Workflow: Exploration Reports
What are exploration reports?
Exploration Reports enable the user to create a customized view of charts from a set of workflows contained in the Exploration.
Use Cases
Exploration reports can be invaluable in a number of situations
- Overview reports : Presenting a subset of information that is captured by a set of workflows, only selecting specific charts that are of interest to a specific team
- Side by side comparisons: Presenting measurements of different versions, applications or experiments side by side for the purpose of understanding improvements or regressions
Usage
Creating Explorations Reports
An Exploration report is created automatically for each exploration and you can access it by selecting the Exploration Report link right under the Exploration name. By default the Exploration Report will contain all the charts that exist in all the deployed workflows in the Exploration.
Modifying Exploration Reports
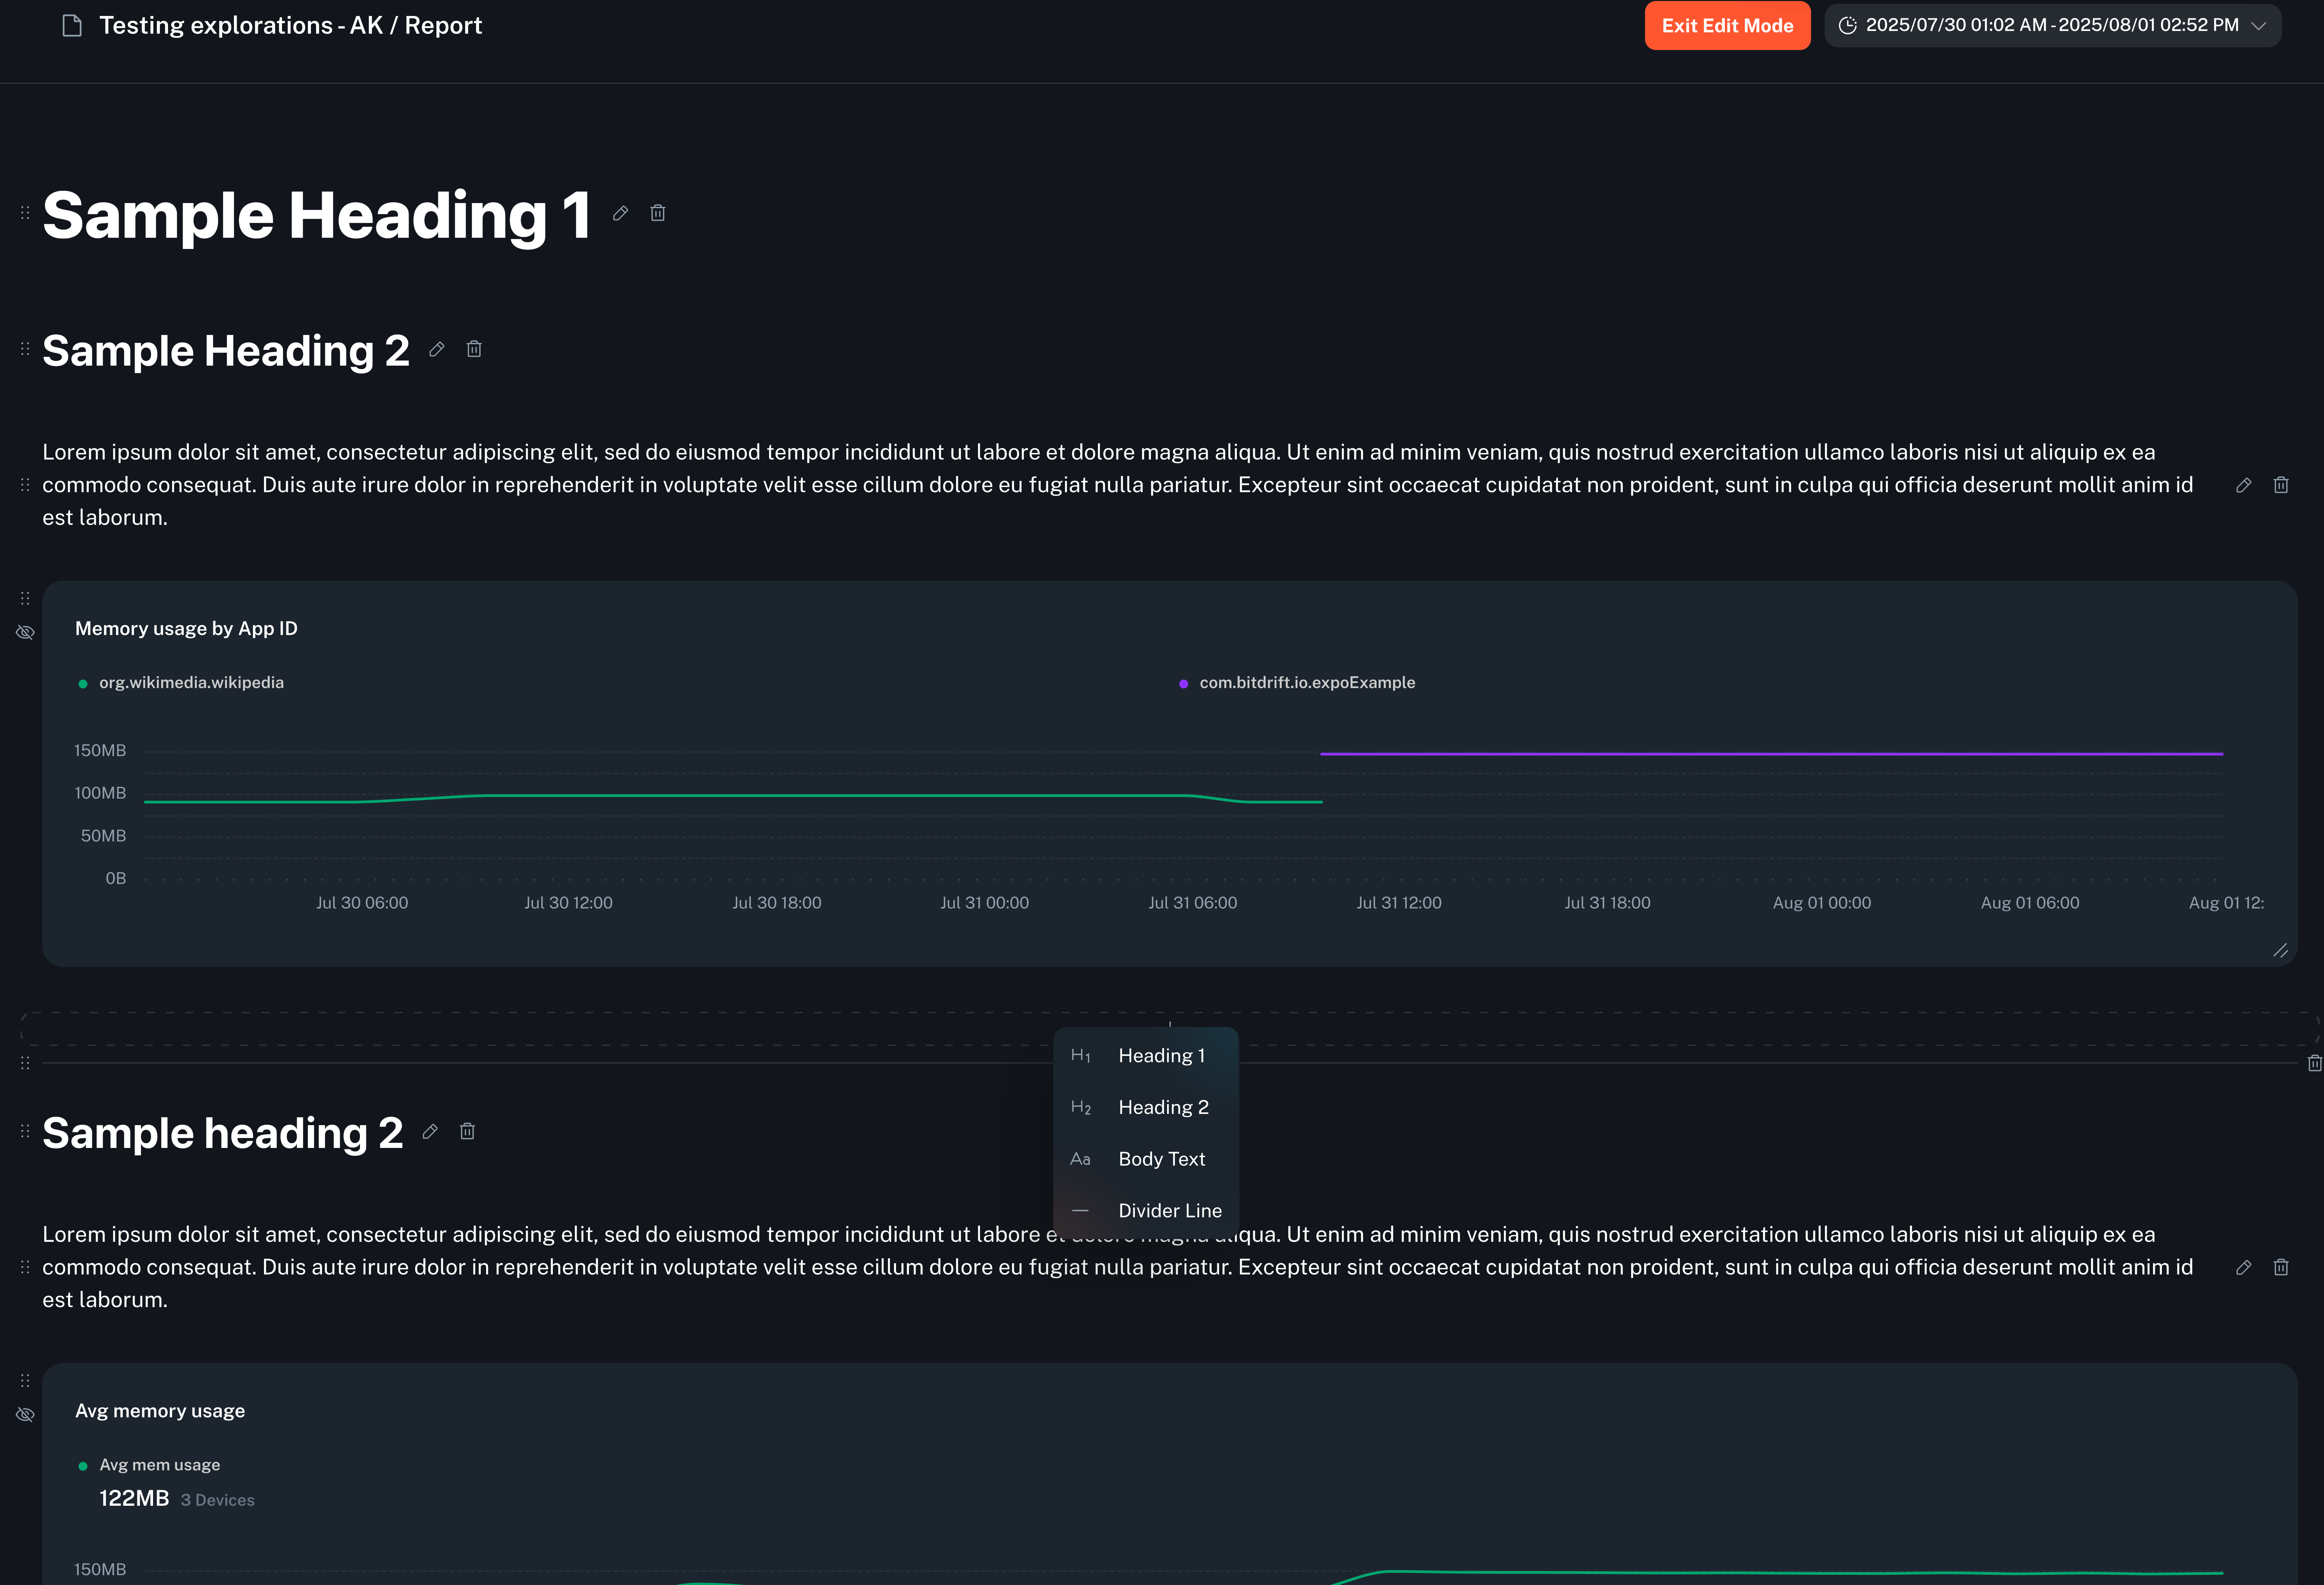
The Exploration reports can be customized by the user by entering edit mode by clicking the Edit dashboard button at the top of the Exploration report view. The customizations are possible the following ways
- Enable/disable the chart : You can disable/enable a chart from showing up in the
Exploration reportby clicking the "Hide" icon on the left side of the chart - Move charts : You can use the anchor icon on the left side of the chart to drag it around the screen and order it a way that is meaningful to what you are trying to achieve
- Resize charts : You can use the
Drag to resizeanchor on the bottom right side of the chart to drag it to a desired size. This includes making the chart larger (multiple rows vertically) or smaller to fit multiple into a single row (multiple column view) - Grouping and adding meta data : You can click the
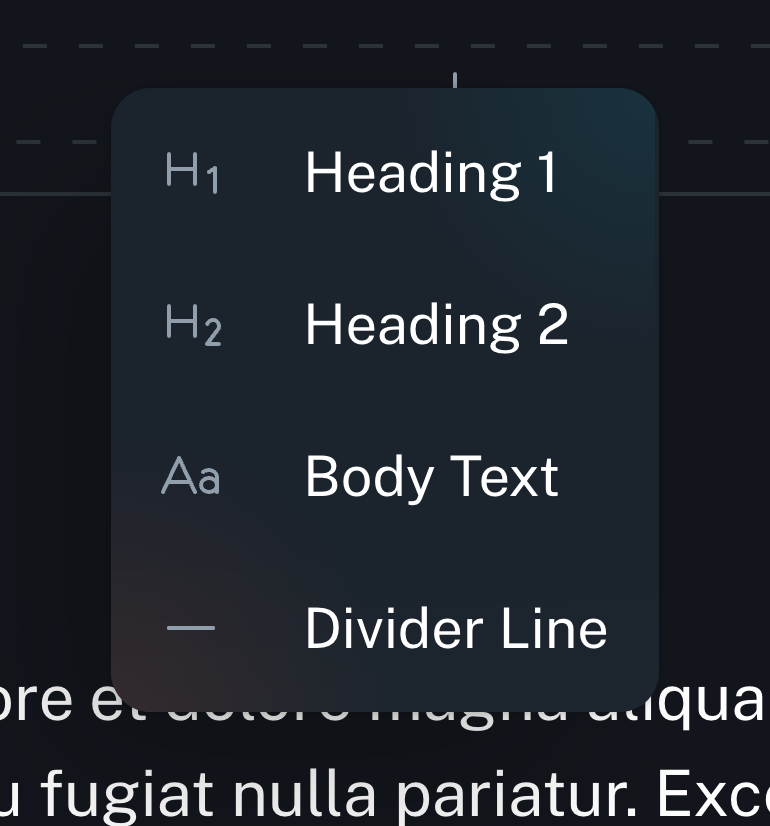
+button between the rows of charts to addHeading1,Heading2,Body textandDividerto section out the charts and add

