Issues and Crashes: Feature Guide
Bitdrift’s issue tracking helps mobile teams detect, prioritize, and resolve problems in an app with full session-level context. This guide walks through the key pages and features available in the issues portal.
Info
See the SDK Guide to configure this feature in your apps.
Issue Views
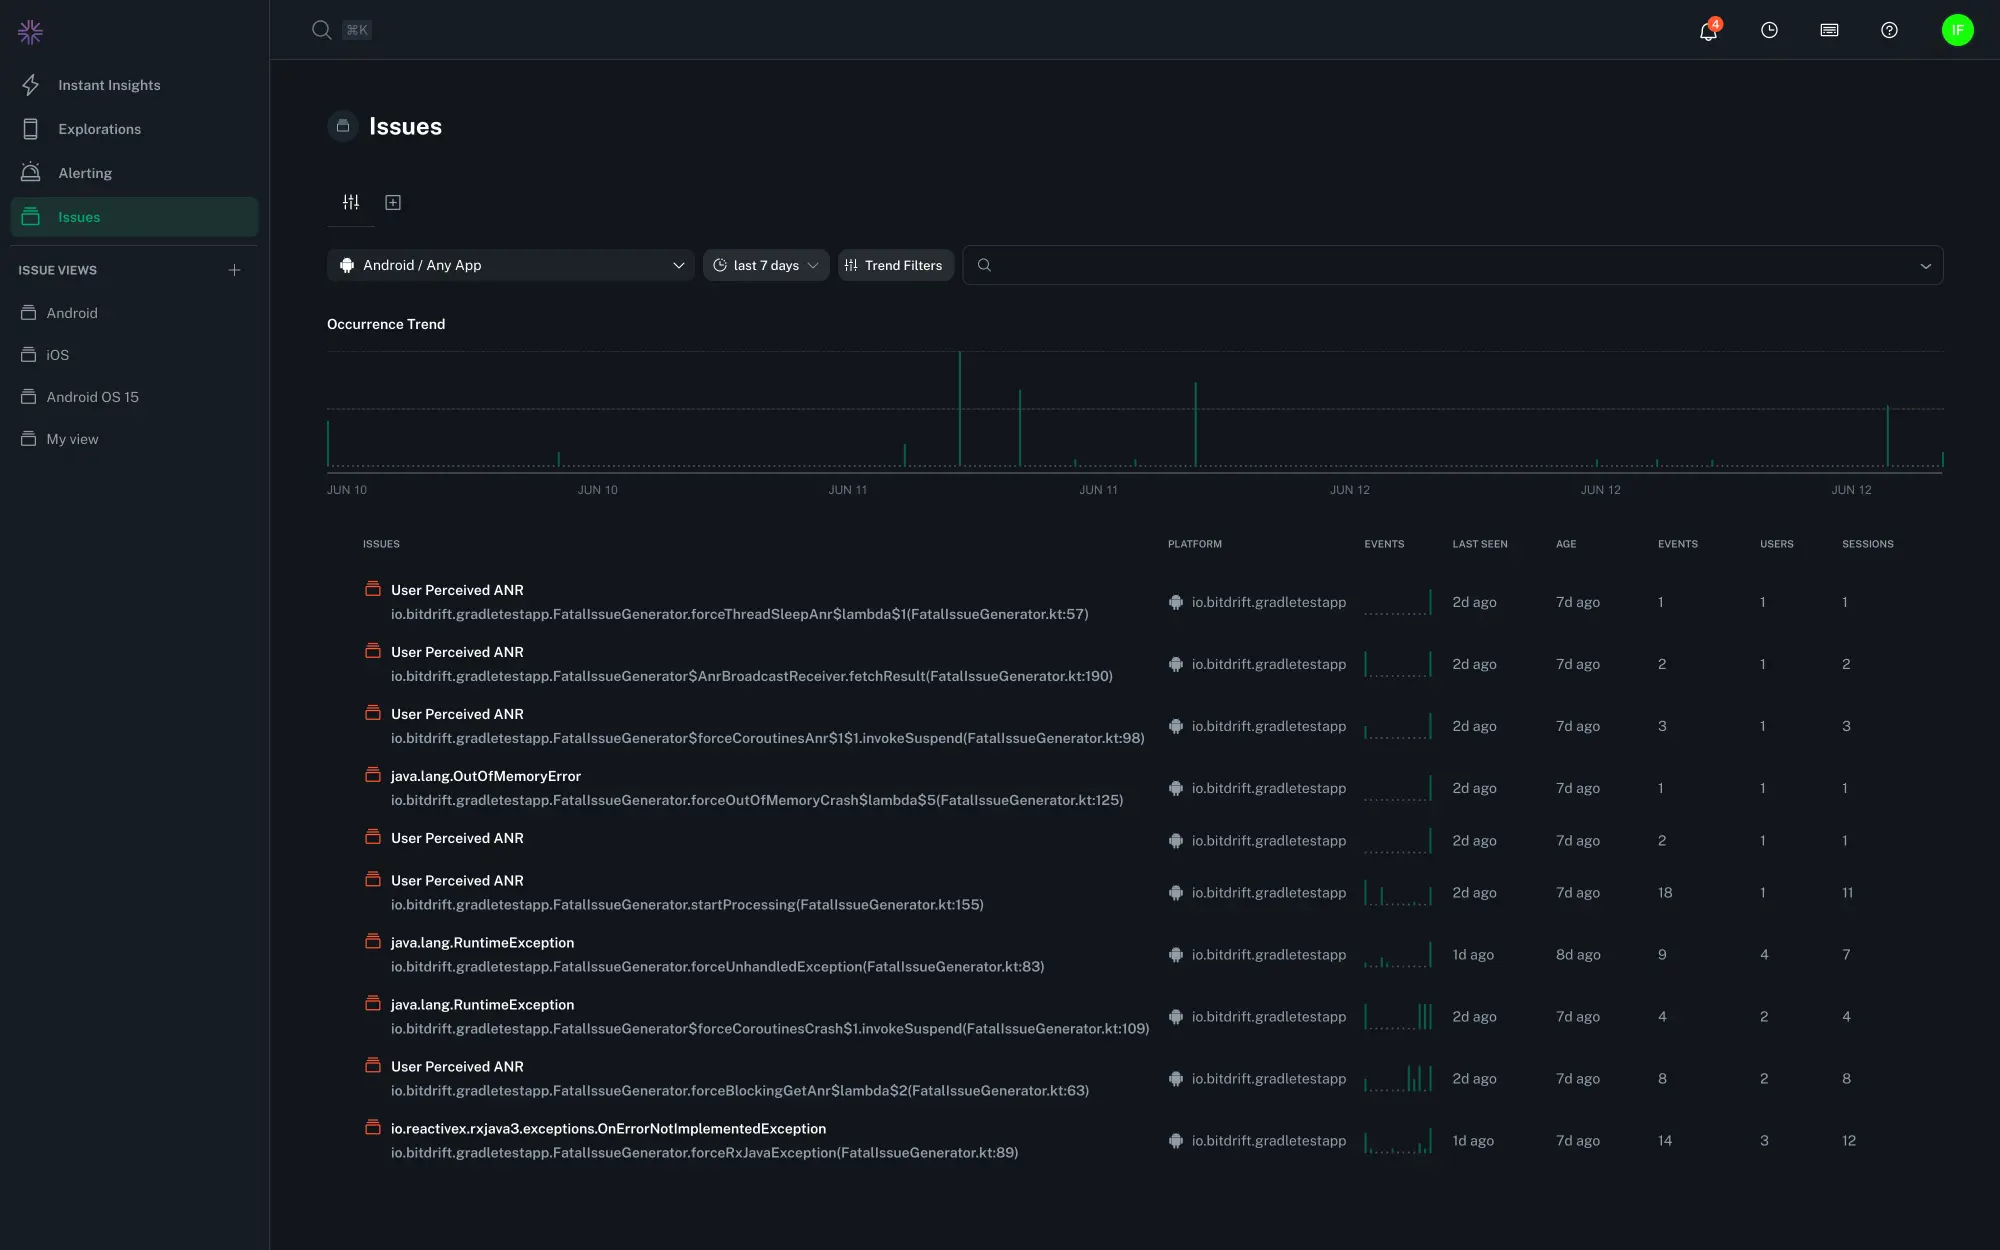
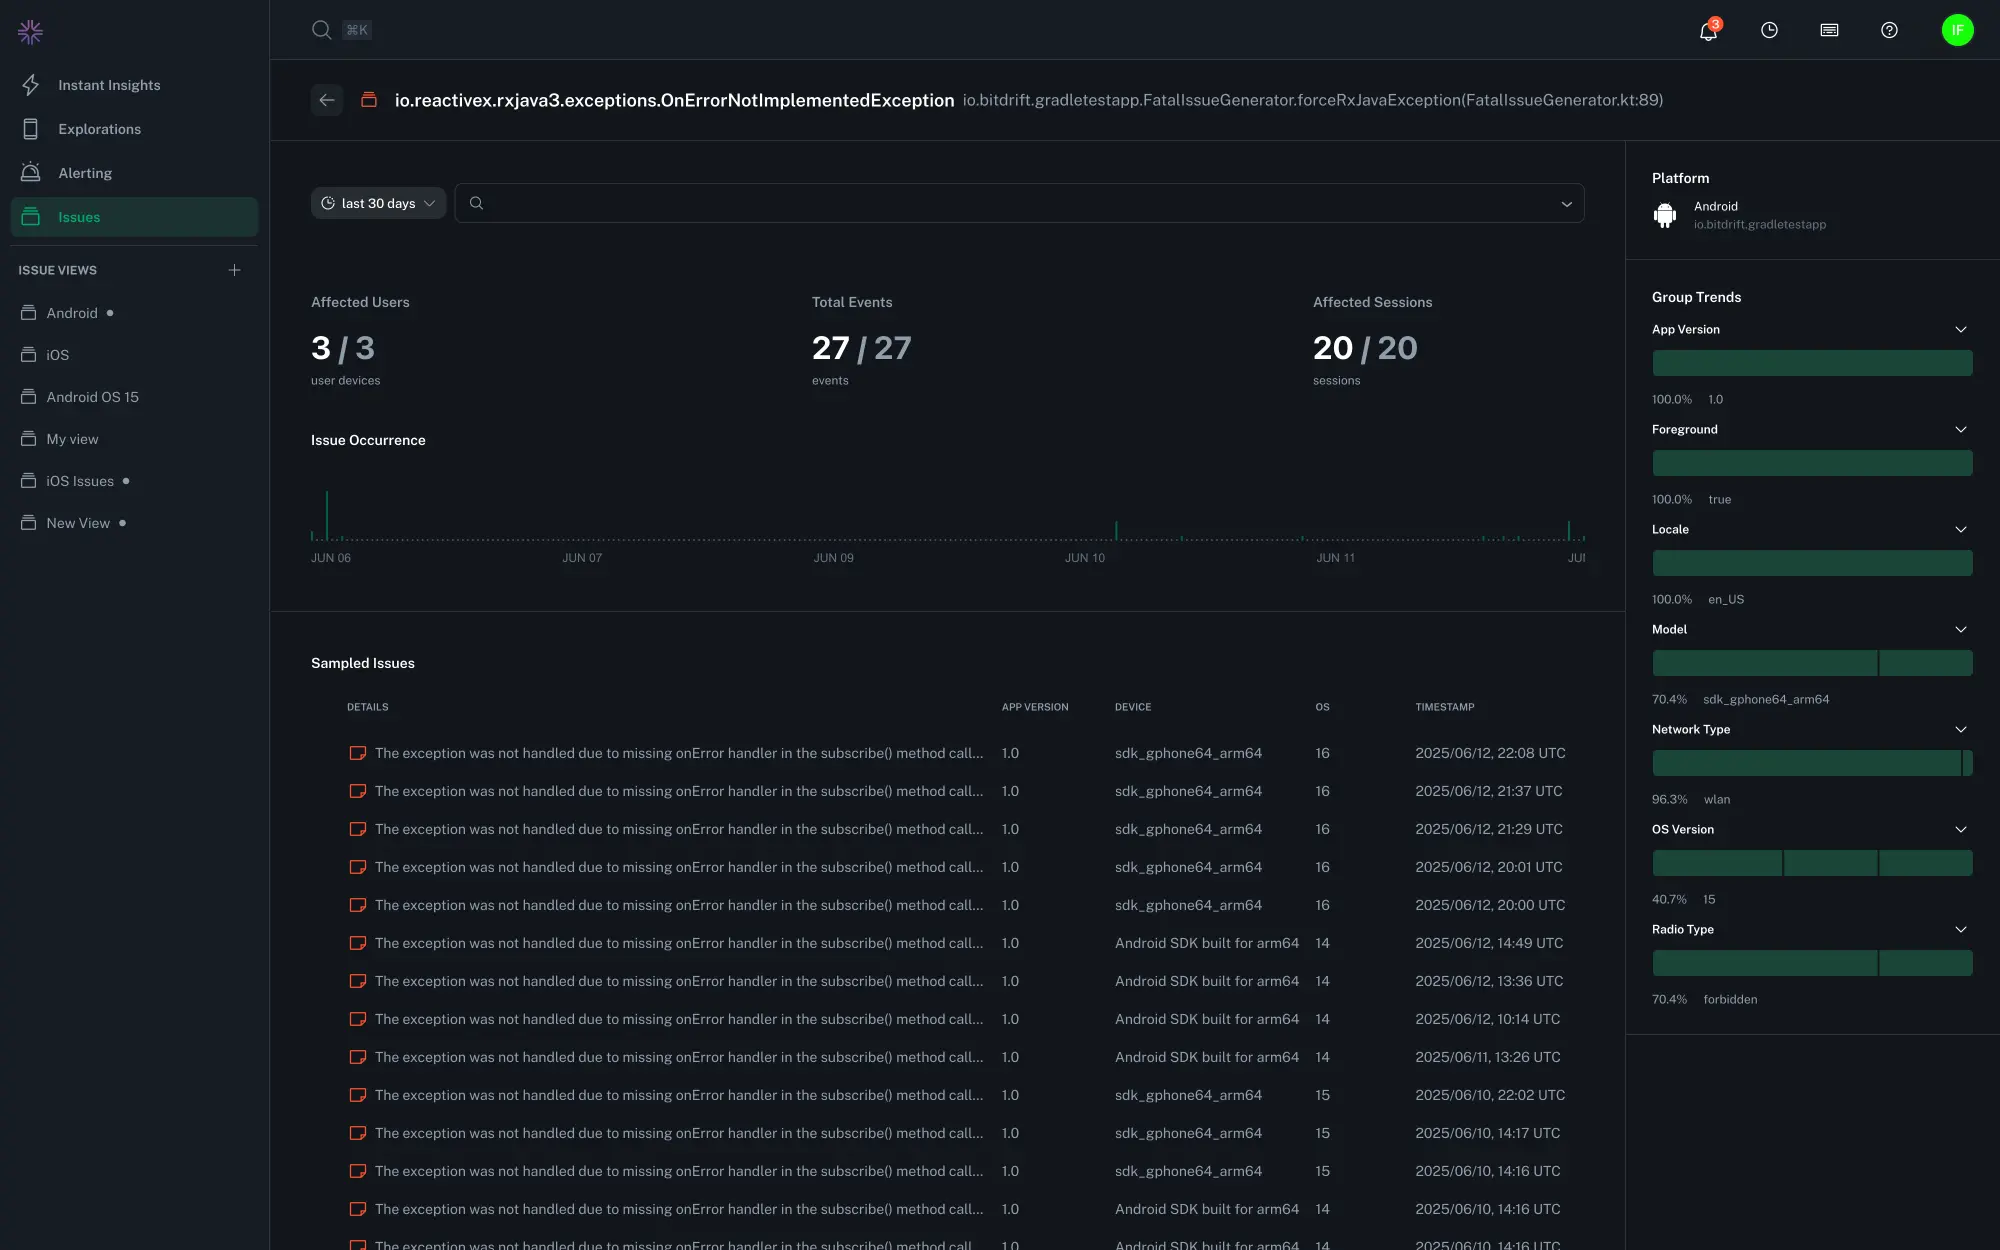
The Issues overview page is the starting point for identifying and triaging the most impactful crashes across your mobile apps. It provides both a high-level view of crash trends over time and a detailed list of filterable grouped issues. Selecting an issue group shows the underlying isssue list, trends, and metrics in higher detail and provides options for filtering and triage.
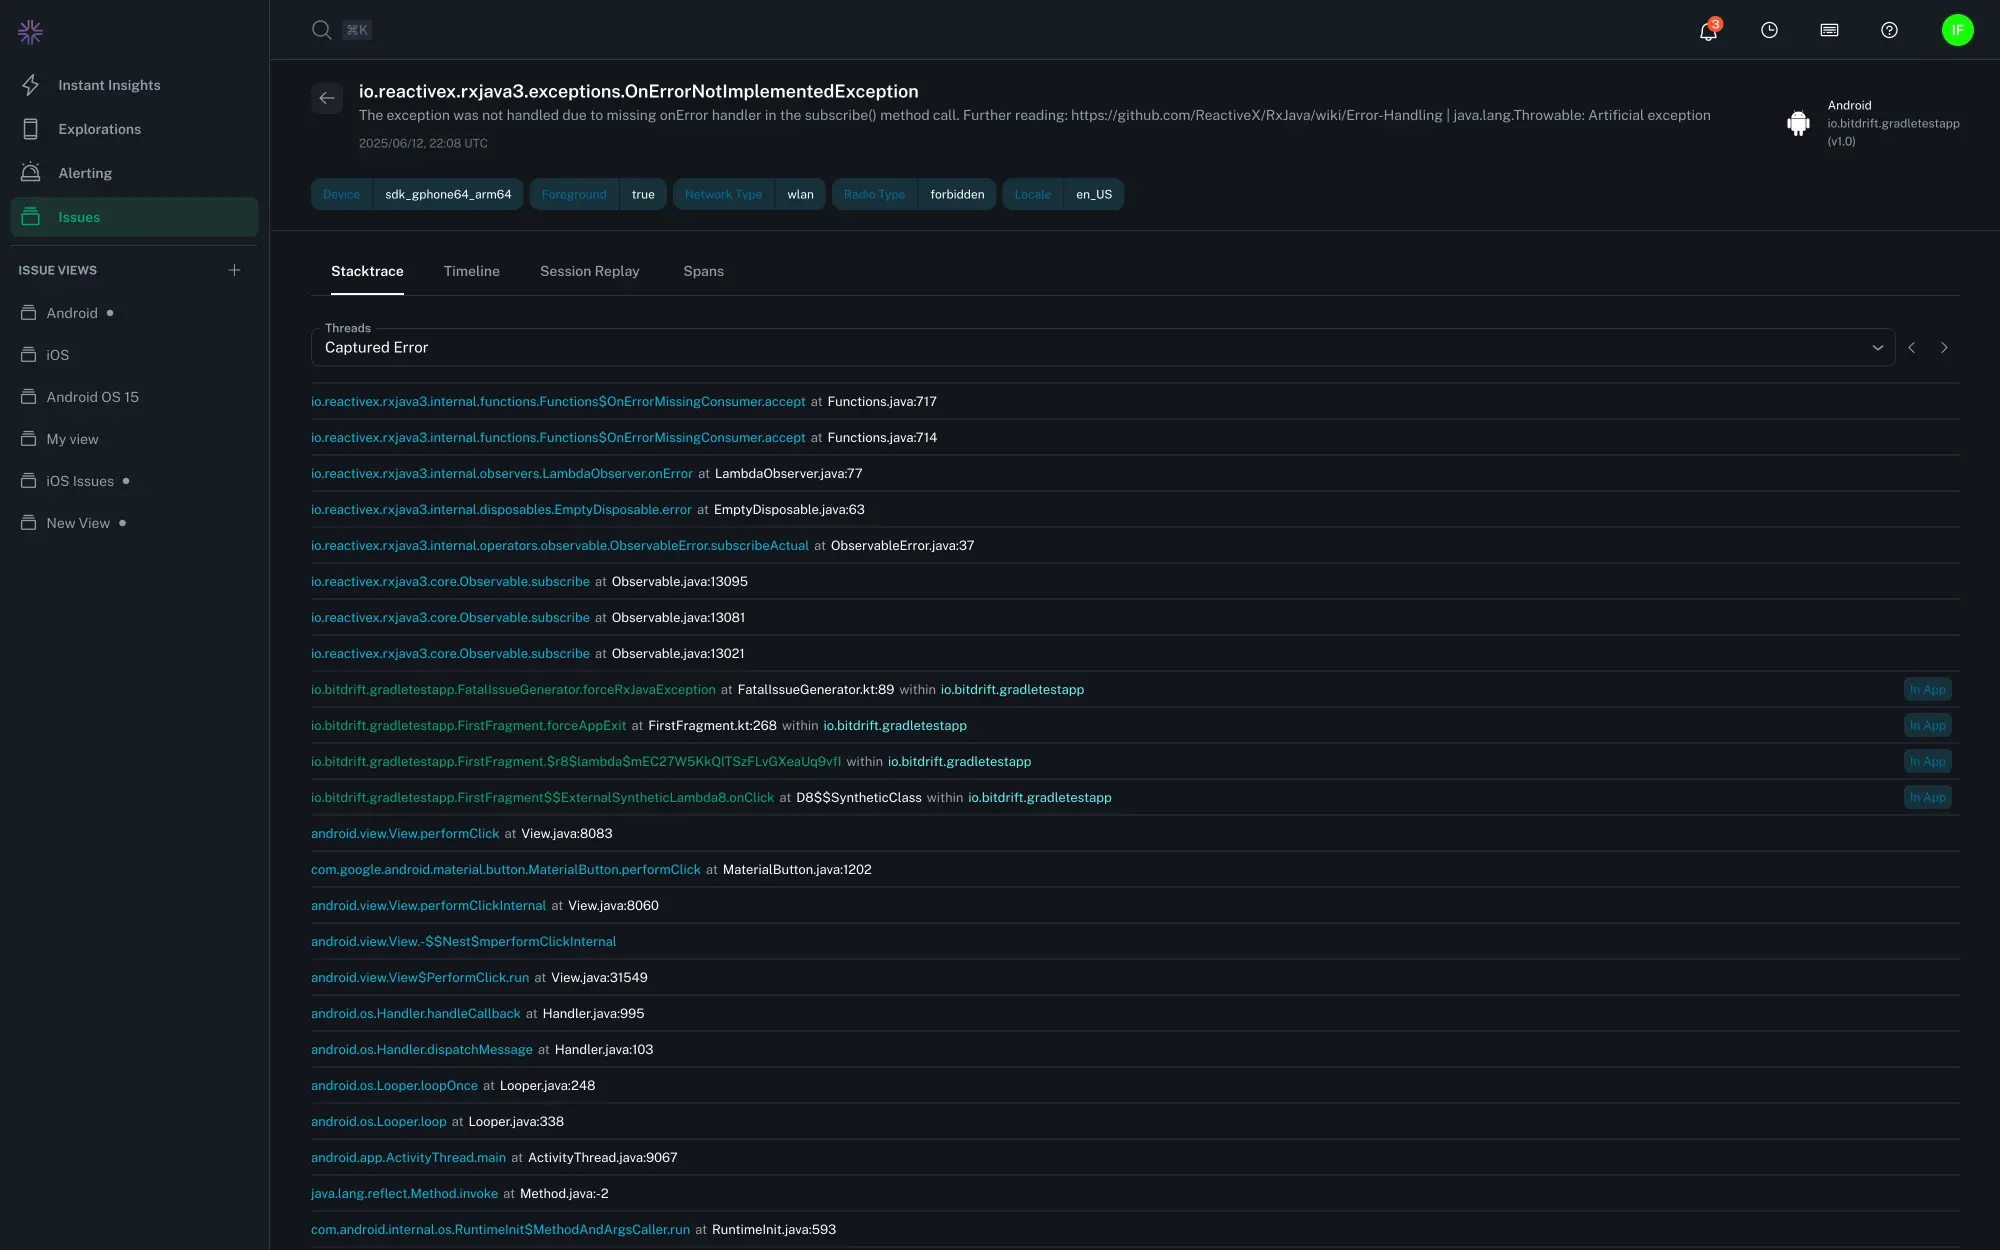
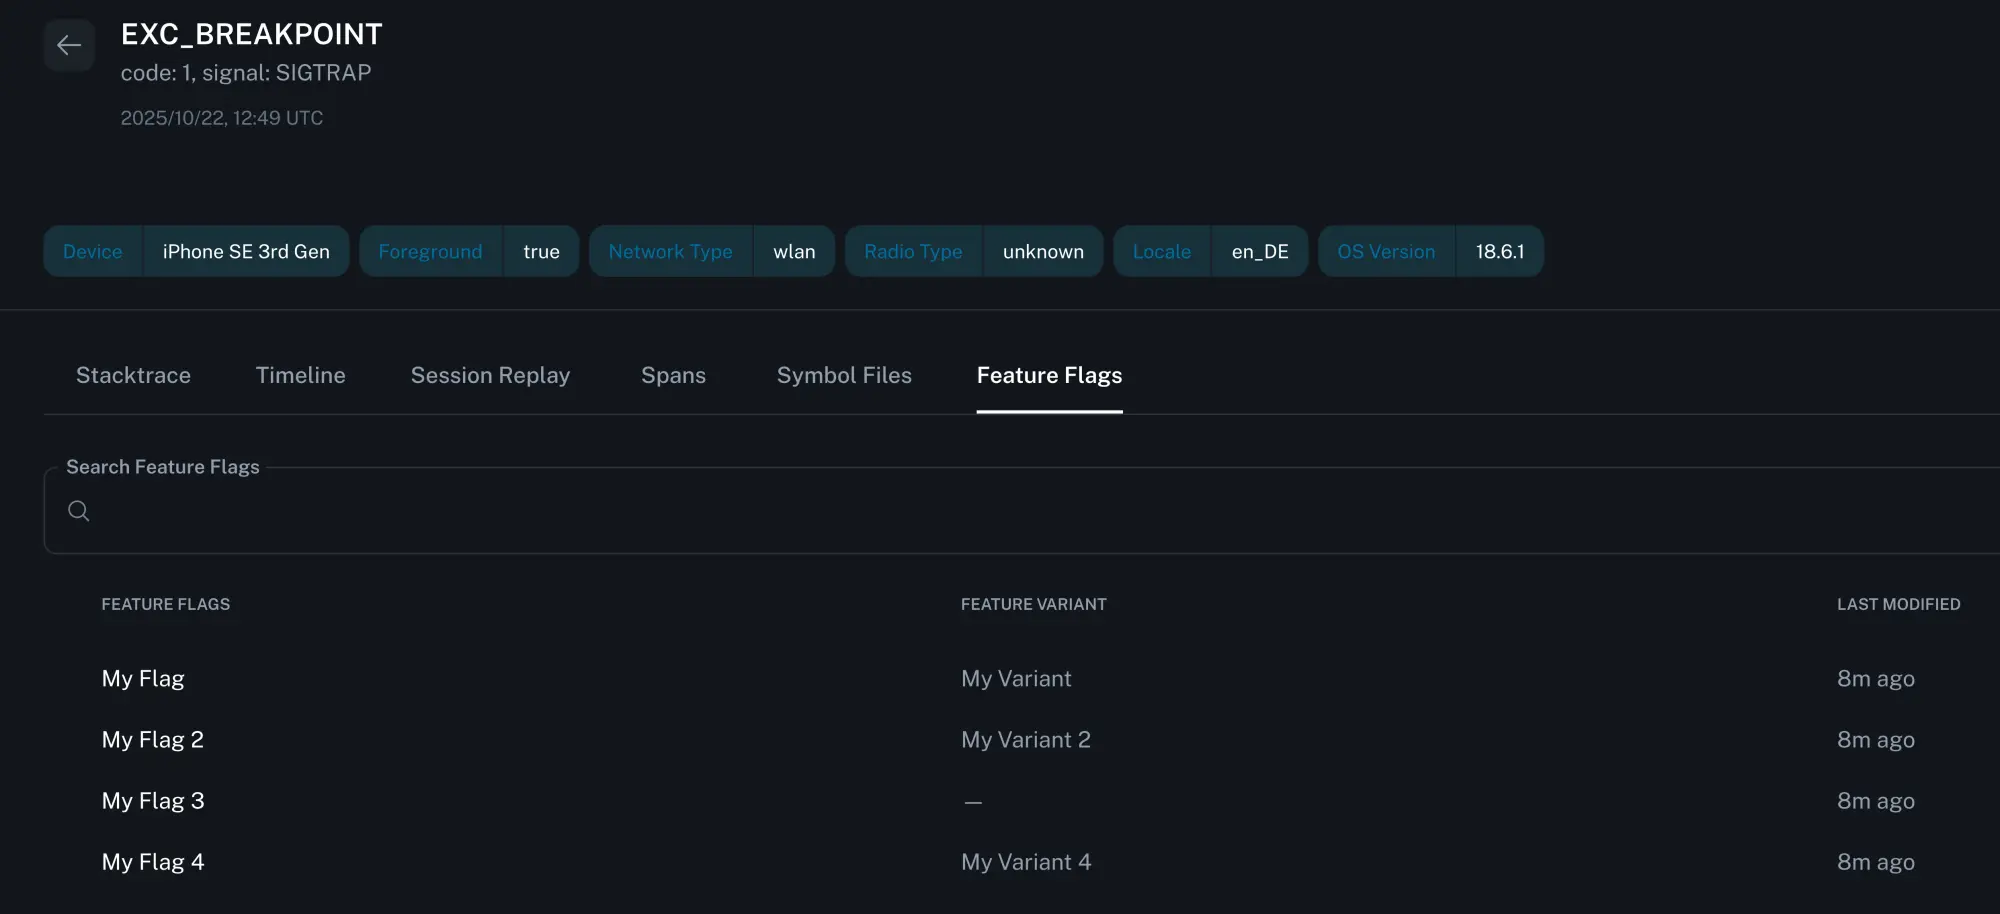
The issue list can be drilled in further to see the individual issue instance with the associated error stack trace, threads, session timeline, and exposed feature flags.
Exploring Issue Details
Individual issues within a group contain fine-grained detail about the operating environment in which it occurred.
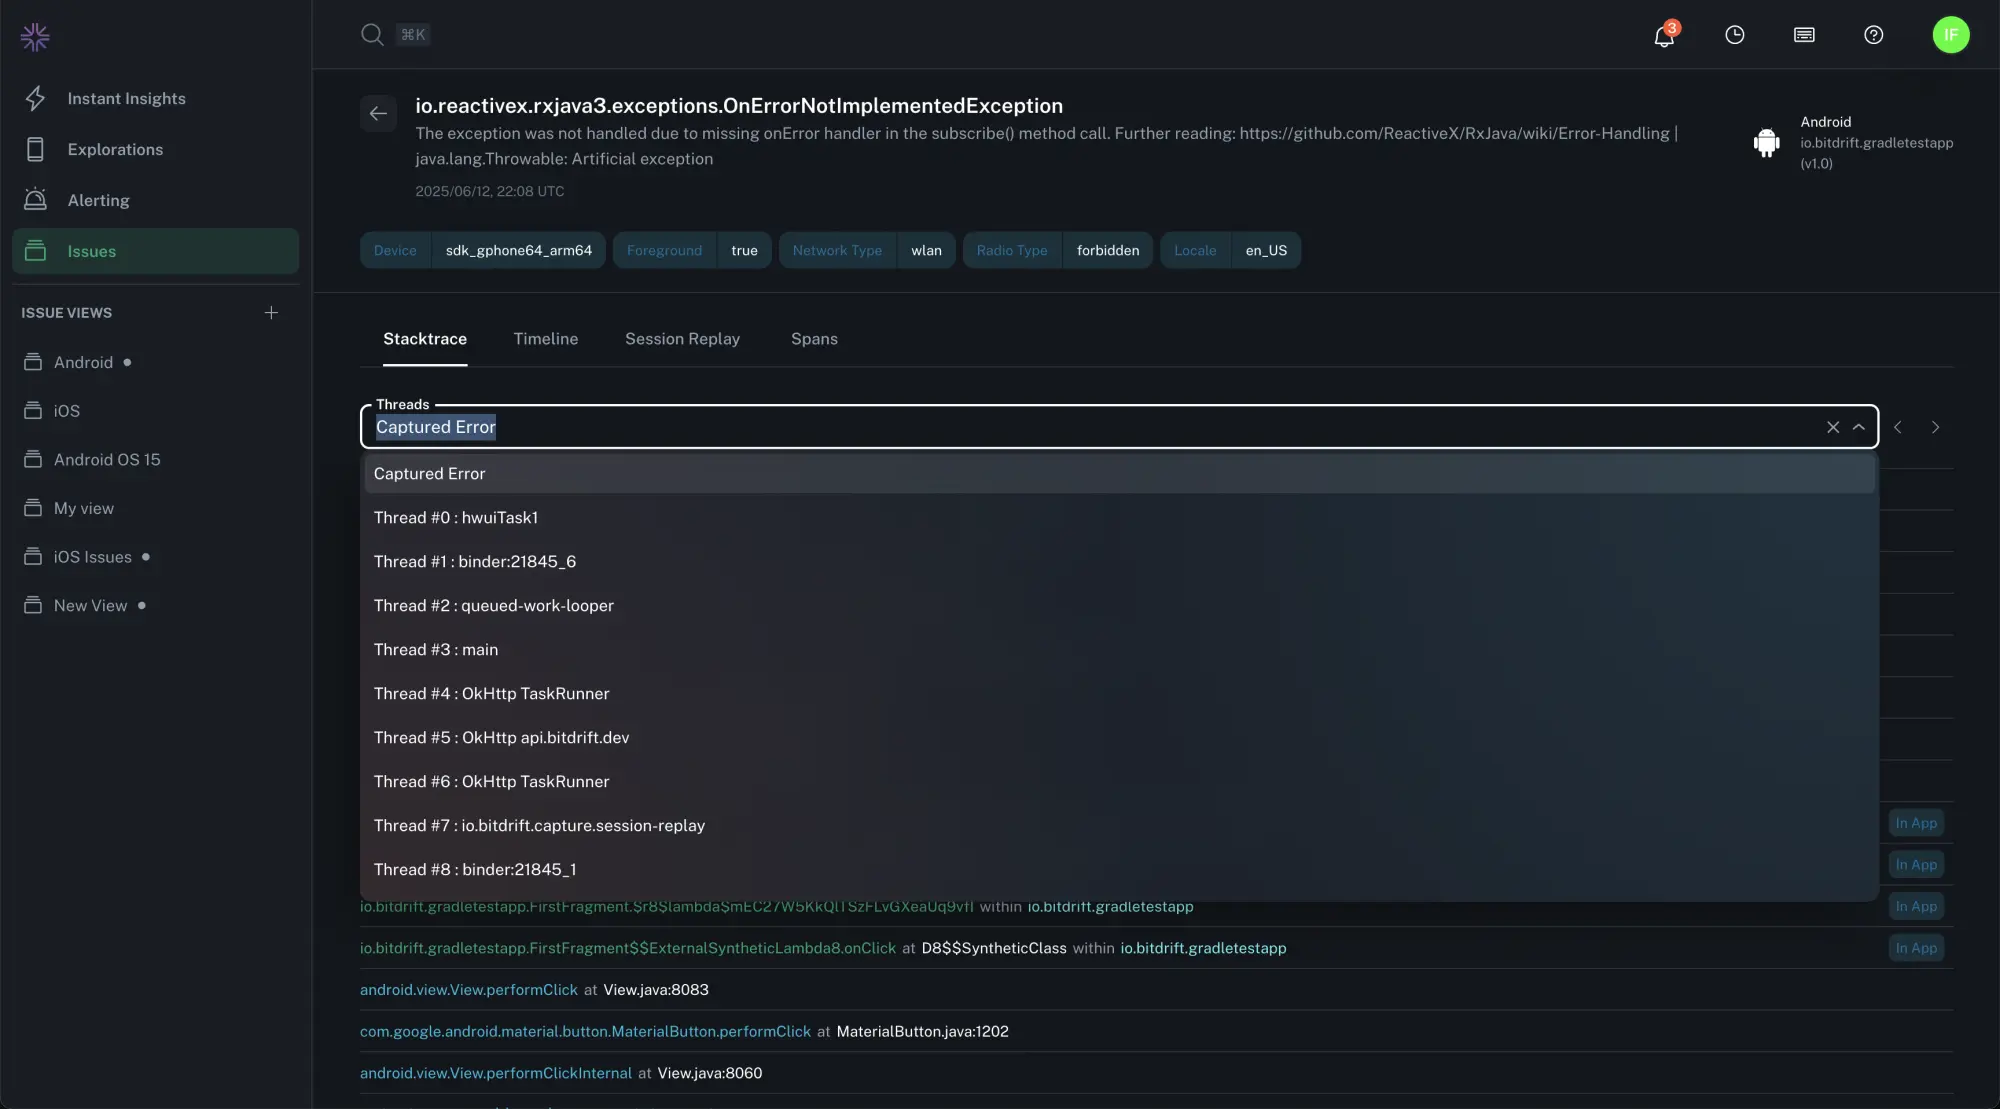
Thread Navigation
There are multiple ways to explore the stack traces of the process when the issue occurred:
- The error and thread dropdown - an auto-complete dropdown menu lets you find and select any thread that was active at the time of the crash
- Navigation buttons - Use the
<and>buttons to quickly cycle through available threads - Press left or right while viewing stack traces to cycle through the thread list
The thread that triggered the crash is labeled as "Captured Error". All other threads are numbered for reference.
Tip
You can search for keywords across all threads using your regular browser search.
Session Timeline and Replay
Select the Timeline, Session Replay, or Spans tabs to see the events which led to an issue.
Filtering
The Issues Overview and Group Detail pages provide filtering to narrow the list of issues by specific attributes, like an app version, platform, or affecting particular user environments.
Filter combinations from the Issues Overview page can additionally be saved and shared across your organization via Saved Views.
Filtering options include:
- Platform and application
- Date and time range, using relative descriptions (like "last 7 days") or defined start and end dates using the date picker
- App and device metrics, such as the app version, foreground/background status, locale, device model, and feature flags
- Investigation status and assignee
- Raw search, for freeform text filtering across several fields
Tip
Many filters support multiple selections or wildcards. For example, use iPhone* to match all iPhone device model variants.
Tip
Fields formatted as semantic versions such as App Version and OS Version support advanced operators like >, <, >=, and <= to help you filter by version ranges. For example, to see crashes affecting iOS 16 and above, you could use the filter OS Version >= 16.0. They also support multiple instances of the same filter, e.g. App Version >= 1.0.0 and App Version < 2.0.0 to see crashes affecting all versions in the 1.x series. Semver matching does not fully implement all aspects of semantic versioning. Major, minor, and patch versions are supported, as well as a basic support for pre-release tags.
Saved Views
To create a reusable filtered view, click the "+" button at the top of the Issues overview page or "Save View" button after adding filters, and finalize the change by selecting the green check mark or hitting the Return key after entering a name. Filters can be adjusted and re-saved later to update the view. The browser URLs on Views are permalinks that you can safely copy and share.
Tip
Use the Search Omnibar (⌘ / ctrl + k) to quickly search for a specific Saved View by name.
Alerts and Notifications
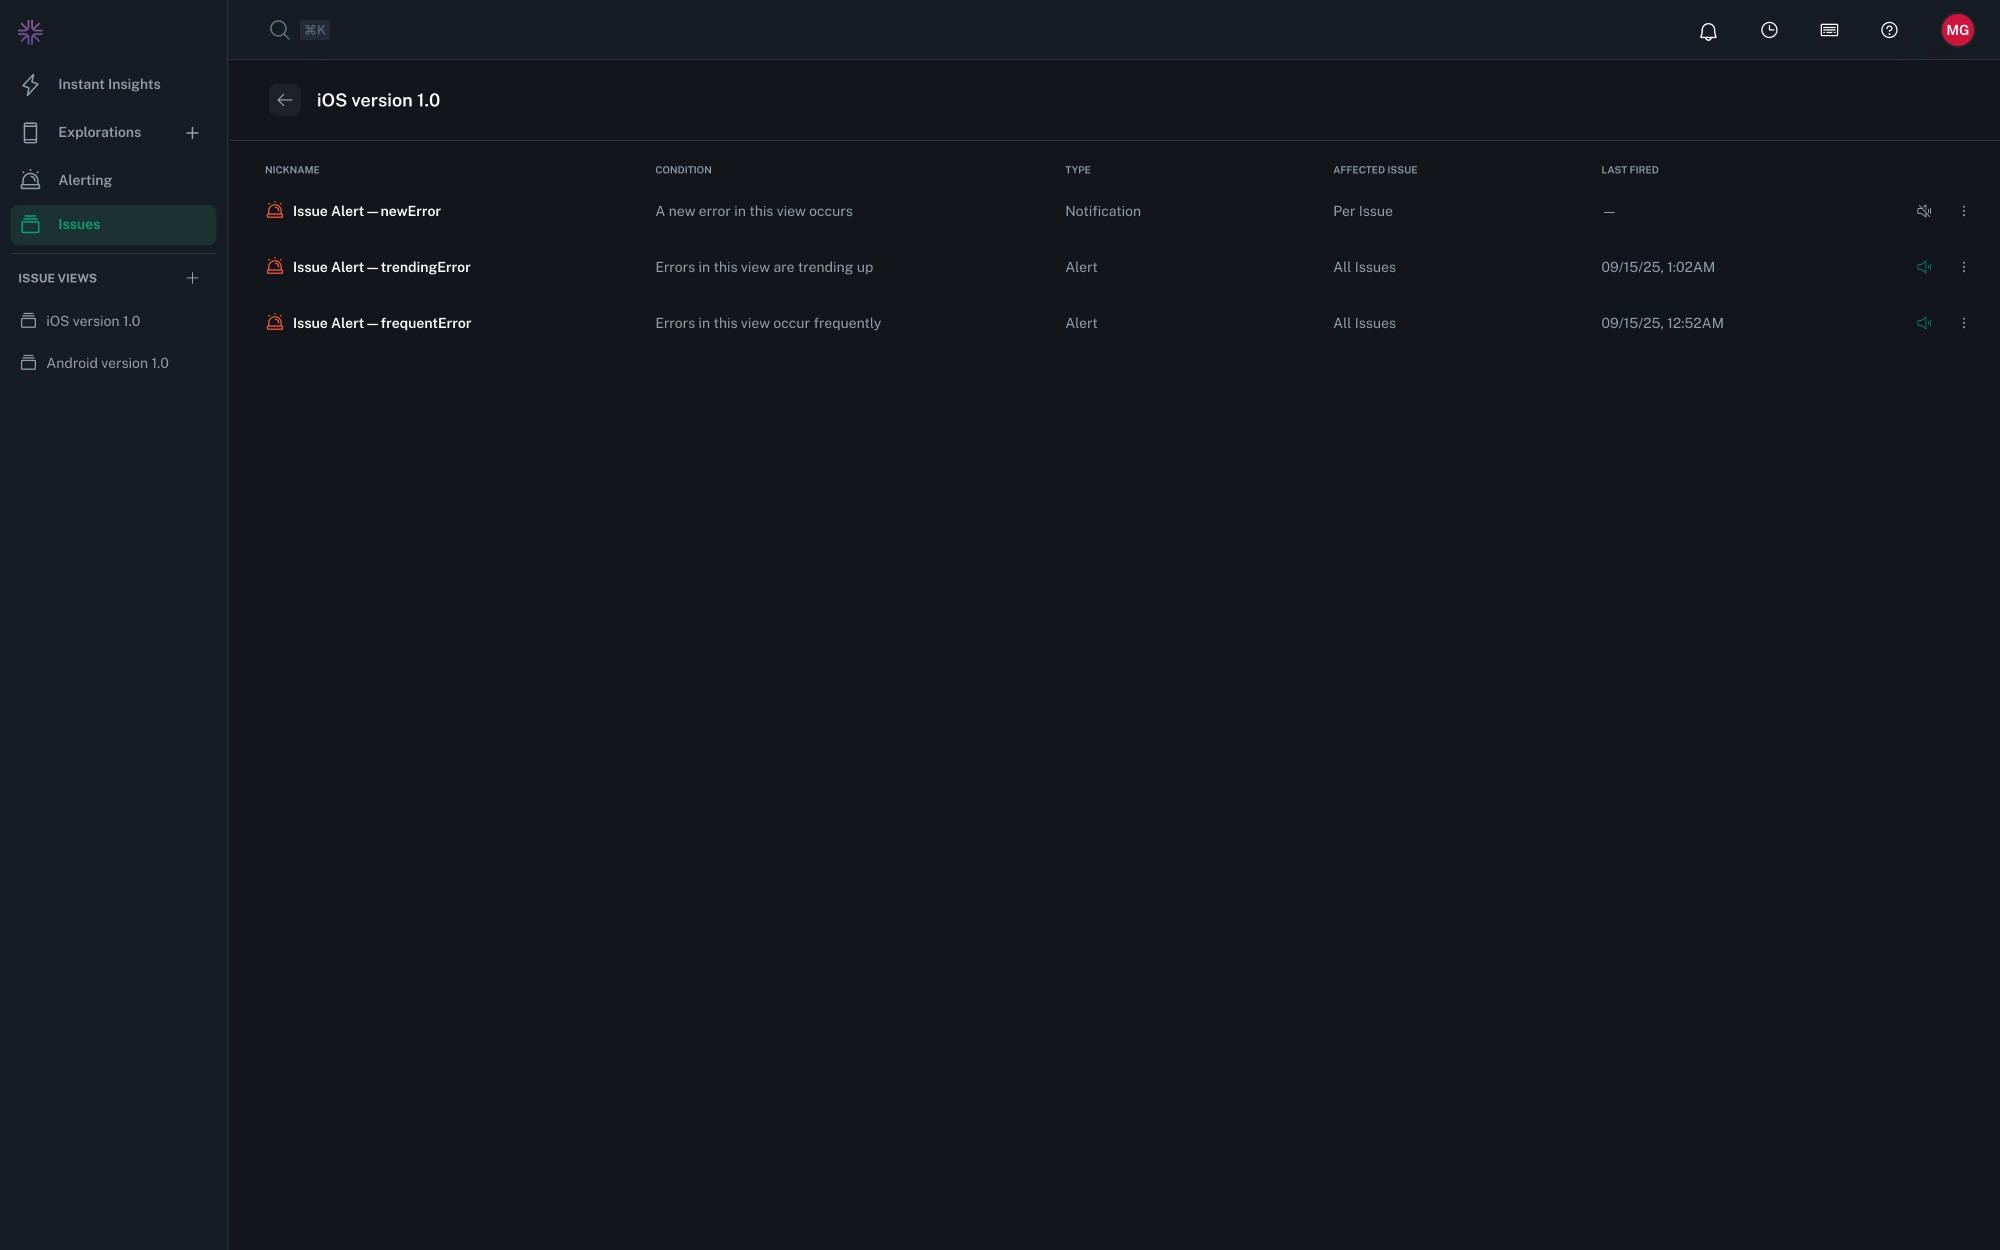
Alerts monitor for issue patterns over time and fire when conditions are met, while Notifications trigger instantly when specific events occur, like a new issue group being detected or a specific issue recurring. Both can be configured to connect to external channels, such as Slack or PagerDuty.
Alerts
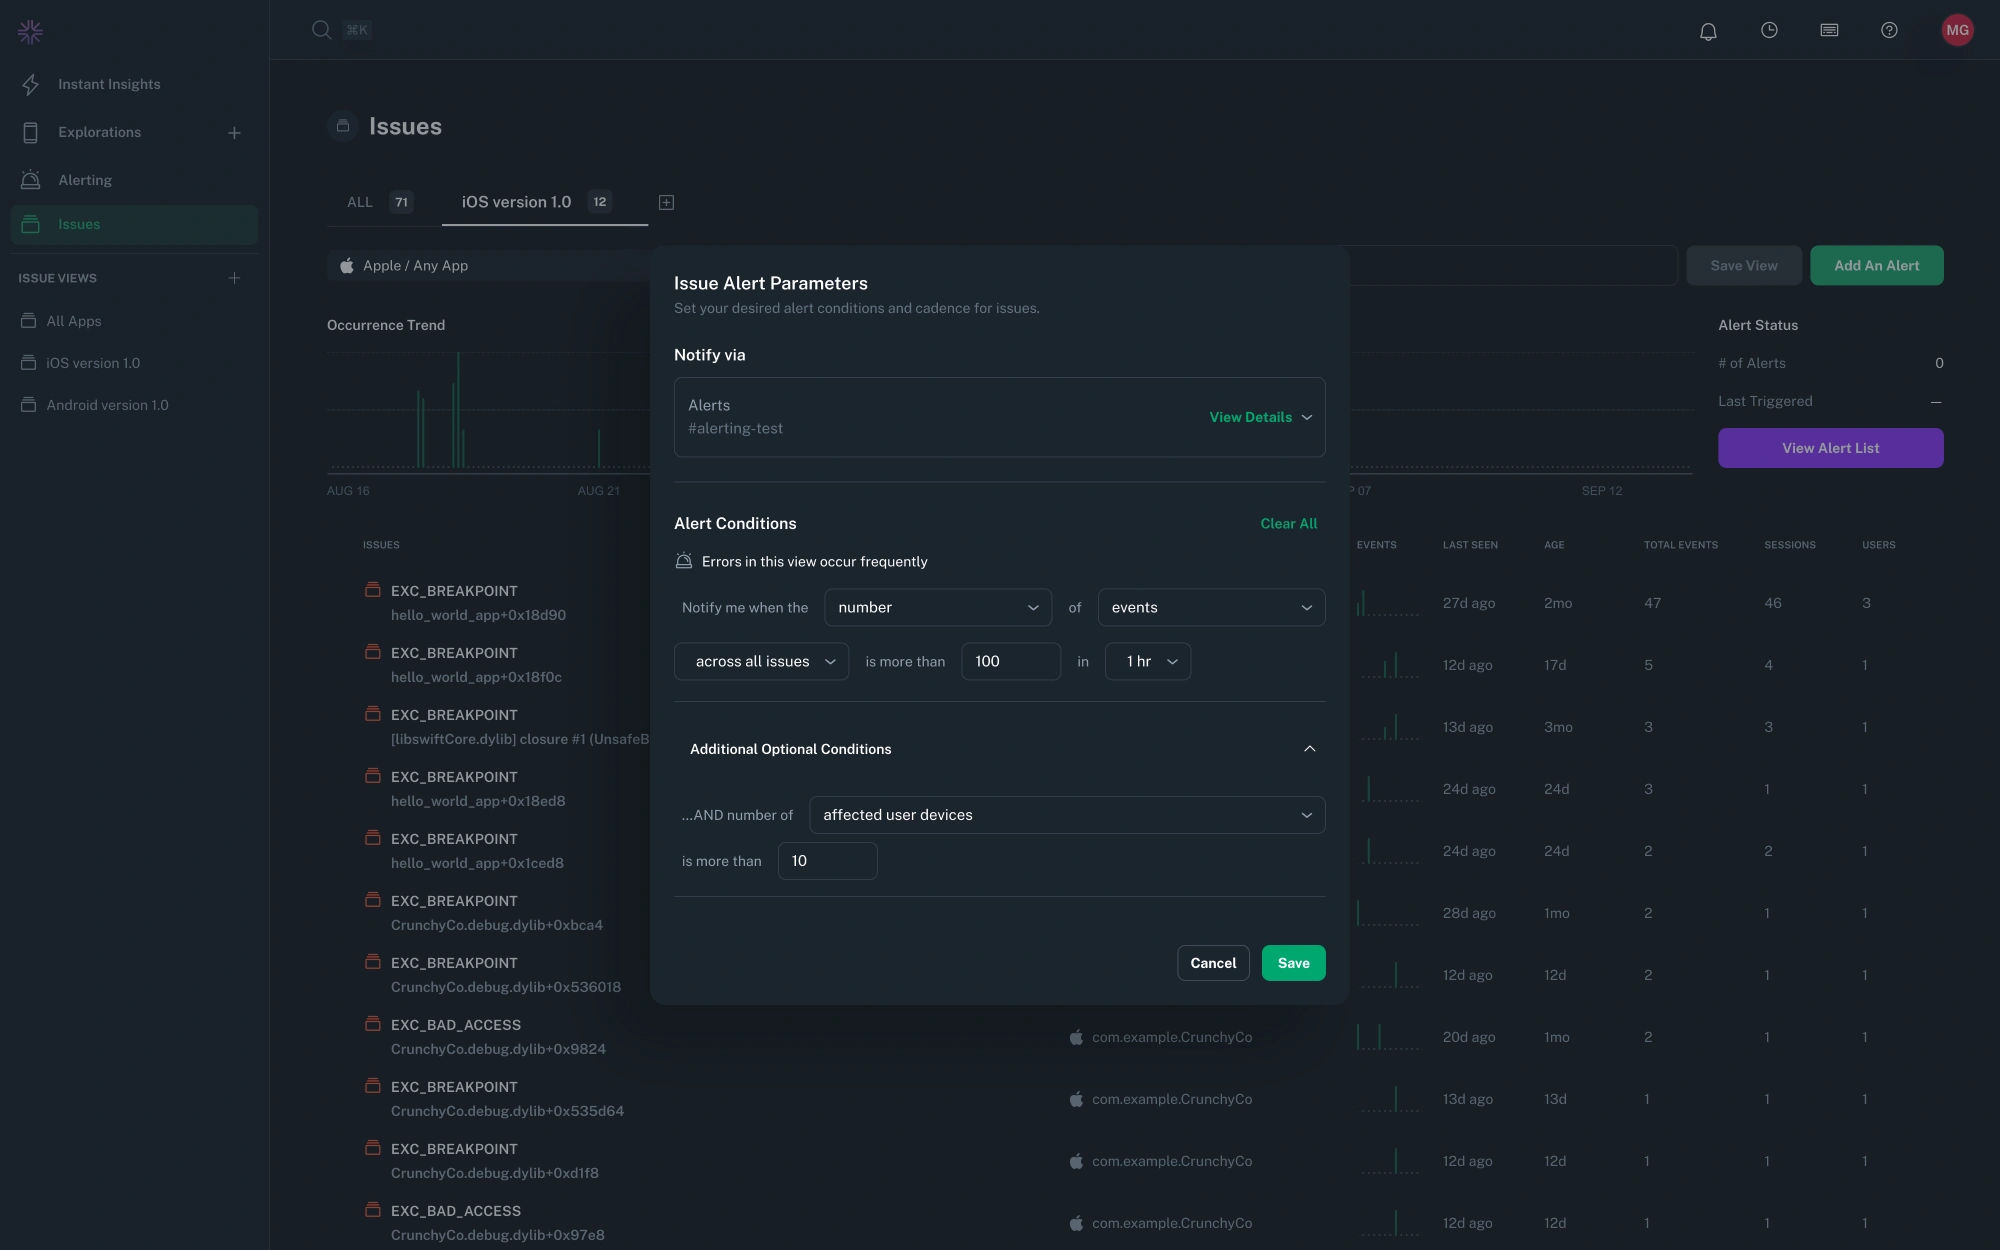
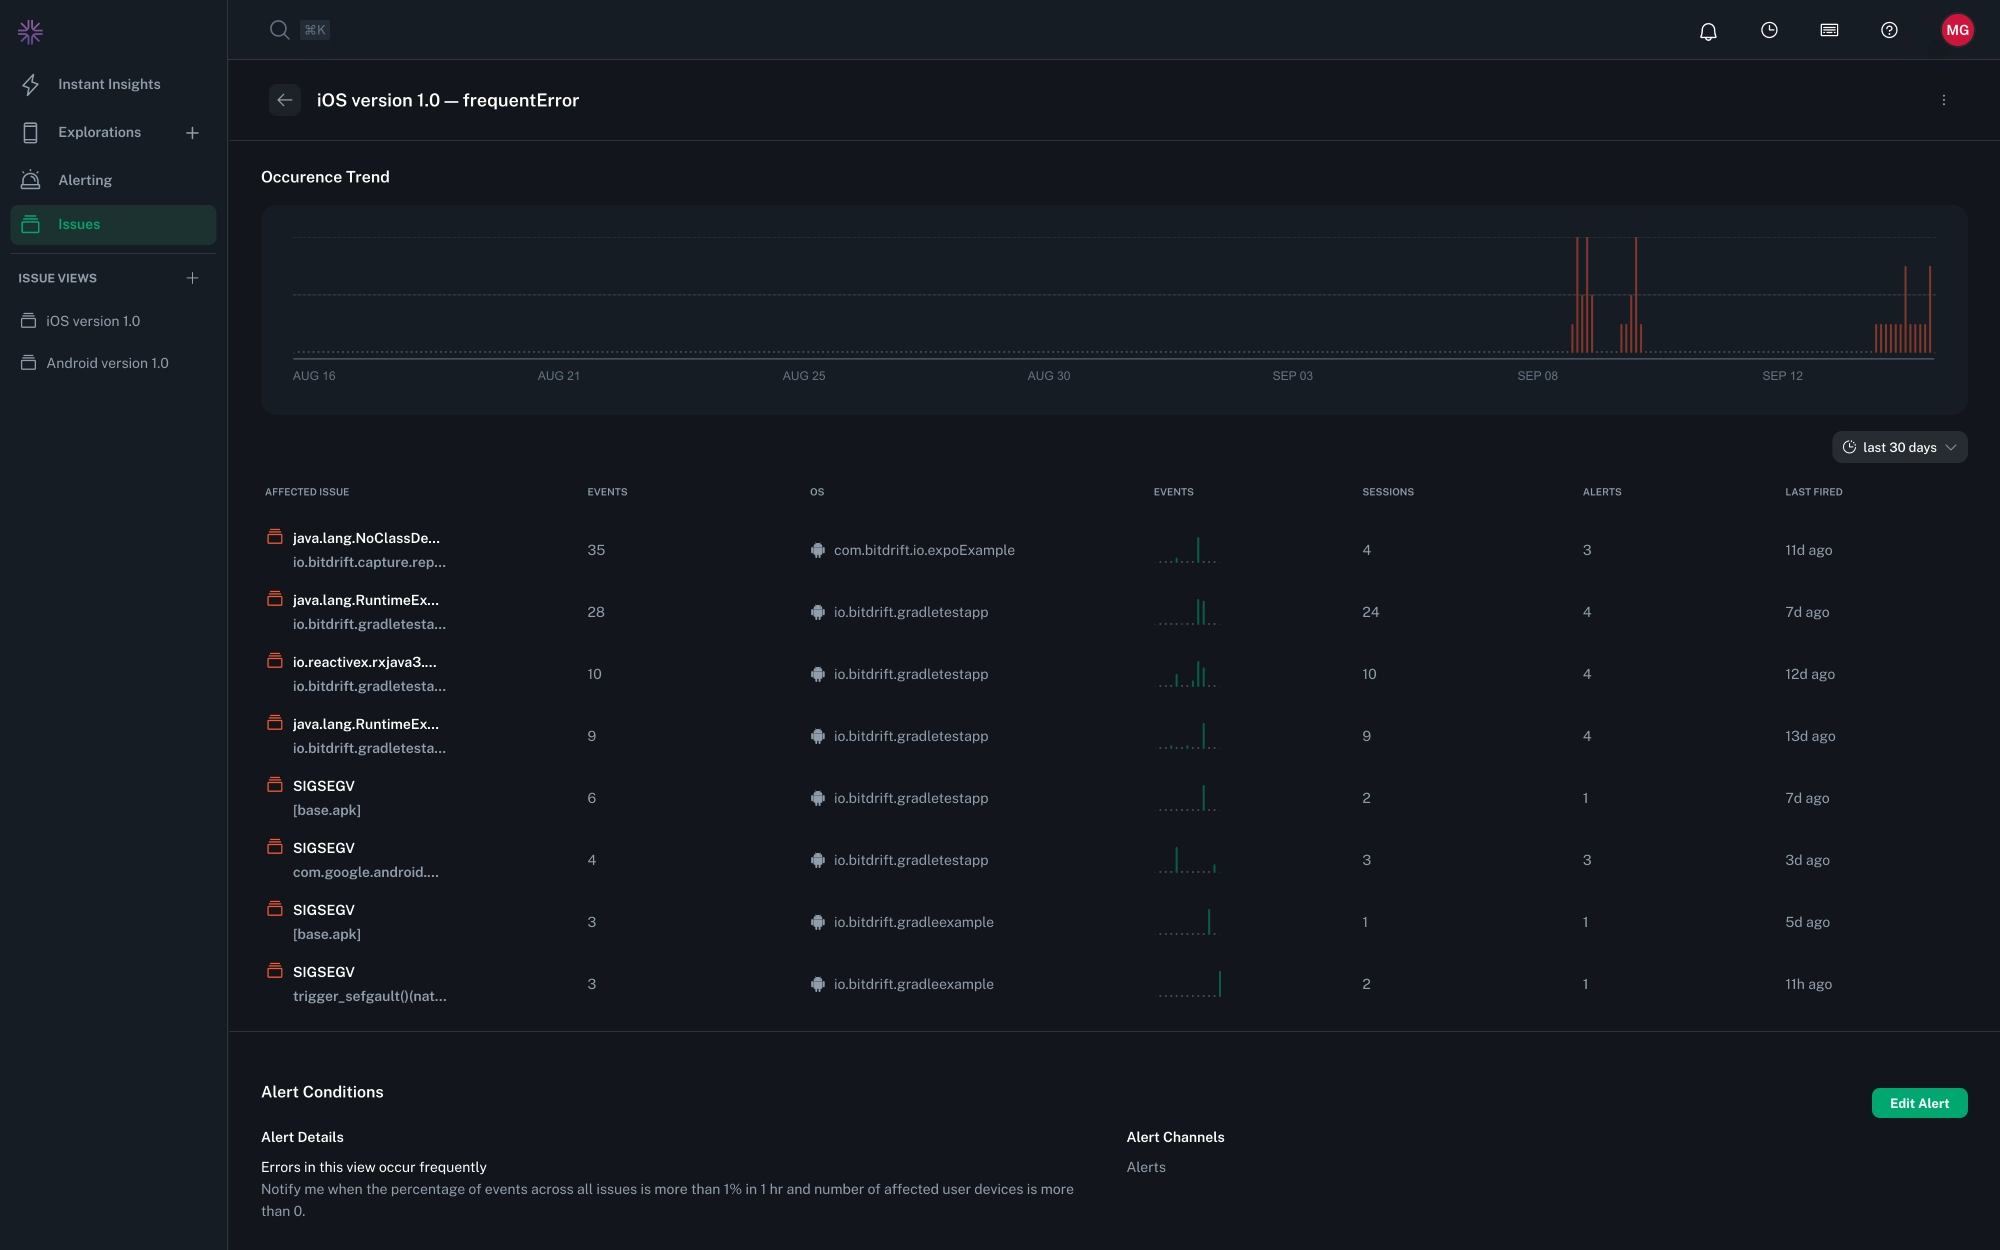
Alerts are associated with a specific Saved View. Each view can have as many alert configurations as needed. Use Alerts to track patterns by frequency or trends in the number impacted users, sessions, or events, or by specific thresholds for a duration:
- Frequency-based monitors fire when issues received exceed a defined threshold within a set time window.
- Trend-based monitors fire when the rate at which issues are received increases compared to a prior time period.
Percent-Based Alerts
Some alert conditions permit activation based on the percentages of affected sessions or user devices rather than absolute counts.
The percentage is calculated using the gross total of sessions or user devices observed in the selected time window for the given app identifier. This calculation does not account for additional filters applied in the View. Percentages therefore reflect app-wide impact, and may differ from filtered counts shown elsewhere.
Notifications
Notifications are associated with a specific Saved View. Each View can have at most one of each notification type. Use Notifications provide immediate visibility to detected issues:
- "New Error" configurations fire when a previously unseen issue is detected, creating a new group.
- "Every Error" configurations fire for each occurrence of an issue, to assist in investigating rare but severe issues.
Triaging
Issue groups can be given an investigation status and assignee for collaboration and tracking when specific problems are resolved. Status and assignee are filterable on the Issues Overview page, and can be modified from the Issue Group Details page.
Status
When a group is created, it is assigned a status of "New," which can be updated as needed as an investigation progresses. When a group marked as "Fixed" receives a new issue with an app version later than the fix version, it is automatically marked as "Reopened." All statuses and built-in behaviors:
| Status | Behavior |
|---|---|
| New | applied automatically when an issue group is created |
| In Progress | |
| Fixed | when selected, records the latest app version associated with the group |
| Reopened | applied automatically when a Fixed issue group receives a new crash with an app version newer than the fix version |
| Ignored |
From the Issues Overview page, the group list can be filtered by particular statuses or using convenience filters like "Status: Open" or "Status: Closed", which correspond to "New, In Progress, or Reopened" and "Fixed or Ignored" respectively.
Assignee
An issue group can be assigned to a member of the organization for investigation. From the Issues Overview page, the group list can be filtered by a specific assignee, "Assigned to Me", or "Unassigned".
Grouping
Issues are automatically grouped based on error type, stack trace contents, and the originating binary. Grouping can additionally be improved on Android by specifying in configuration which packages belong to an organization.
Uploading Debug Symbol Files
Debug information (or "symbol" files) are required to generate human-friendly stack traces from production apps. See the SDK Guide for uploading debug information files for how to configure manual or automatic uploads for app releases.
In-App Frames (Android)
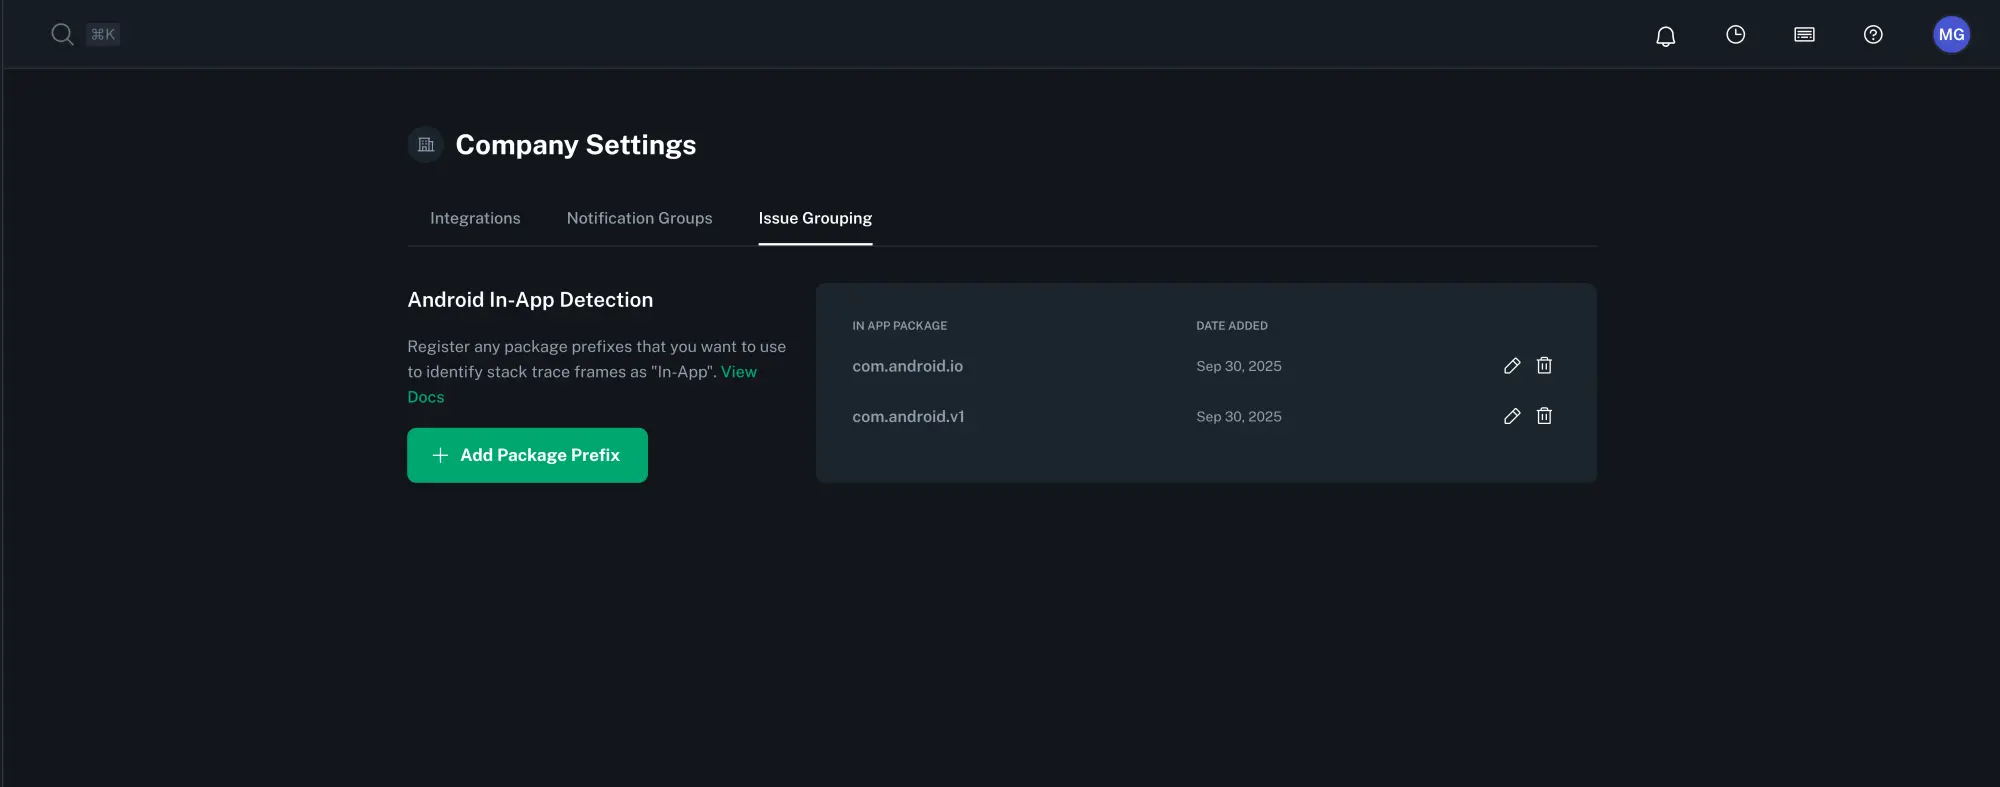
In order to detect which frames in a stack trace belong to your app, bitdrift automatically looks for fully qualified function names that start with your applicationId/packageName. If you want to further customize this logic you can do so via the Company Settings menu.
To add a package prefix:
- Navigate to Company Settings > Issue Grouping.
- Select Add Package Prefix and enter your application’s package name or company's reversed domain (e.g.
com.company), adding as many entries as needed. - Once registered, all in-app frames that match that prefix will be attributed to your app.
Existing Issue Groups
Uploaded package names will only be applied to new issue events. Existing events will not be re-grouped retroactively.
