Timeline: Feature Guide
Core Concepts
- Sessions: Periods of app usage for a user on a specific device, depending on your session strategy.
- Session Replay: Bandwidth and privacy conscious screen captures of user activity within a session.
- Timeline: Visualization of logs within a session in a timeline-centric view.
- Event Logs: Events that are emitted as logs either by the SDK itself or via custom logging.
Info
See the SDK Session Management section for information about how to configure a session strategy.
Session Timeline View
Session Details
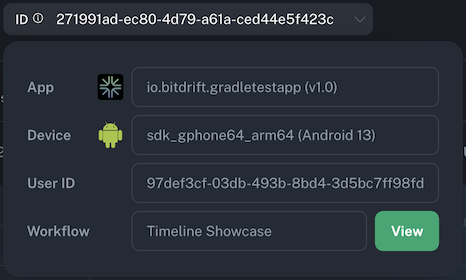
When visualizing a session you can expand the info to see the app, device, and user details (if configured).
Tip
If this session was opened while navigating from an Exploration, the referenced Workflow will be linked at the bottom.
Minimap
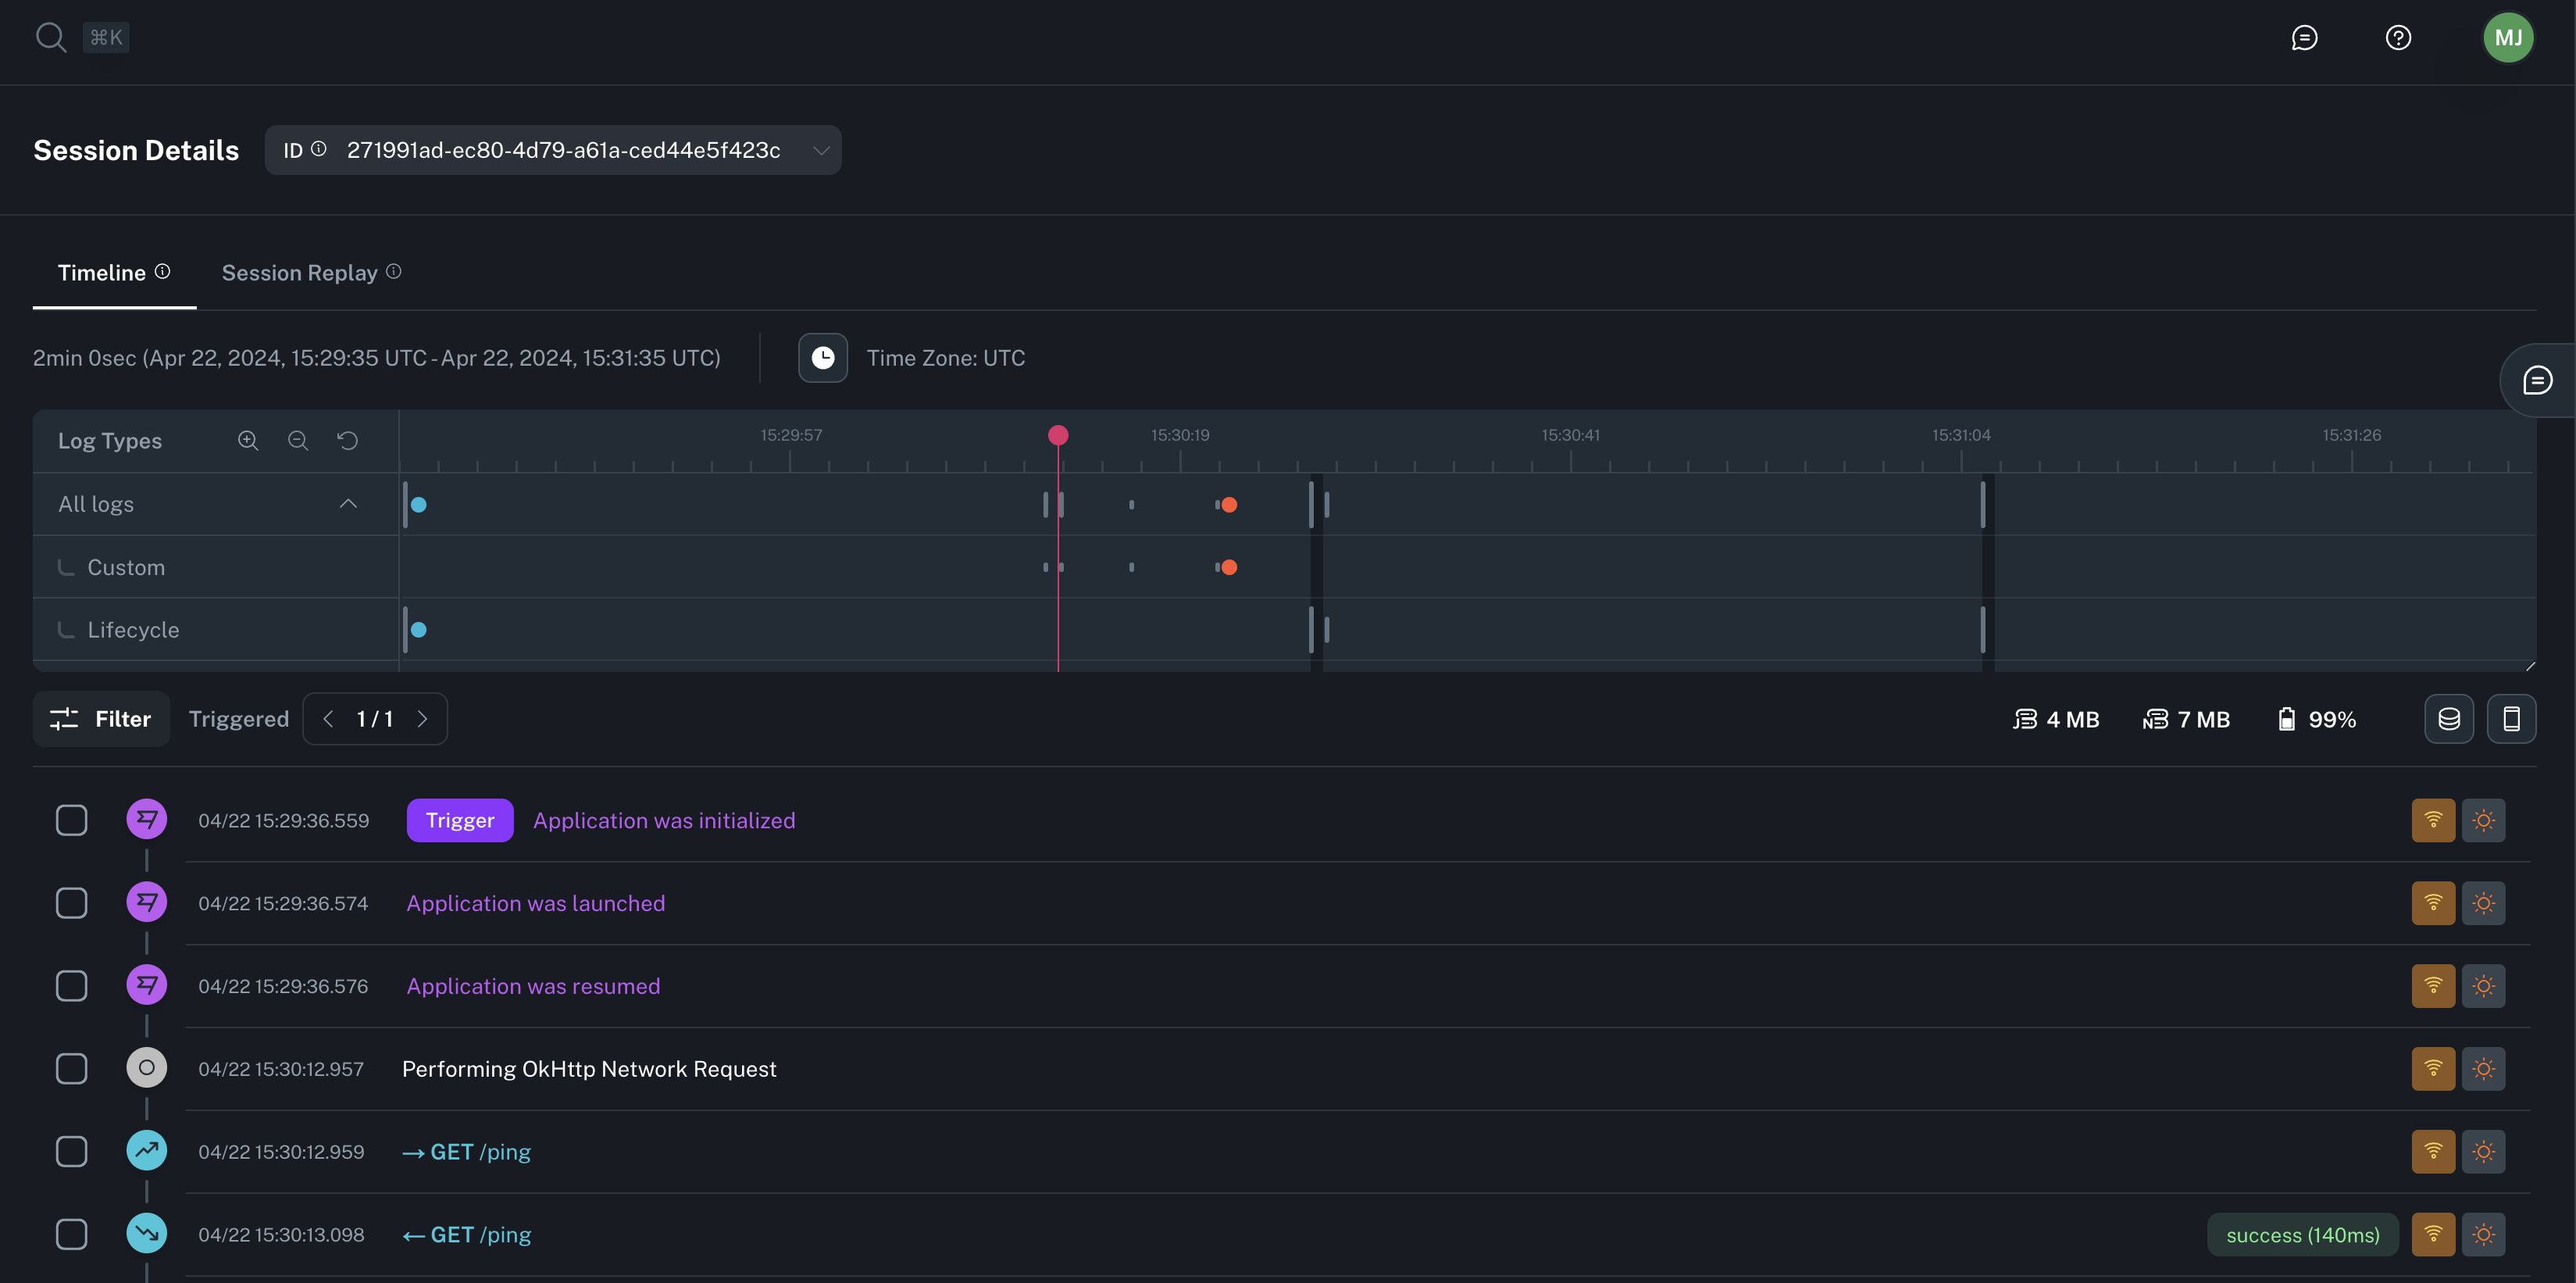
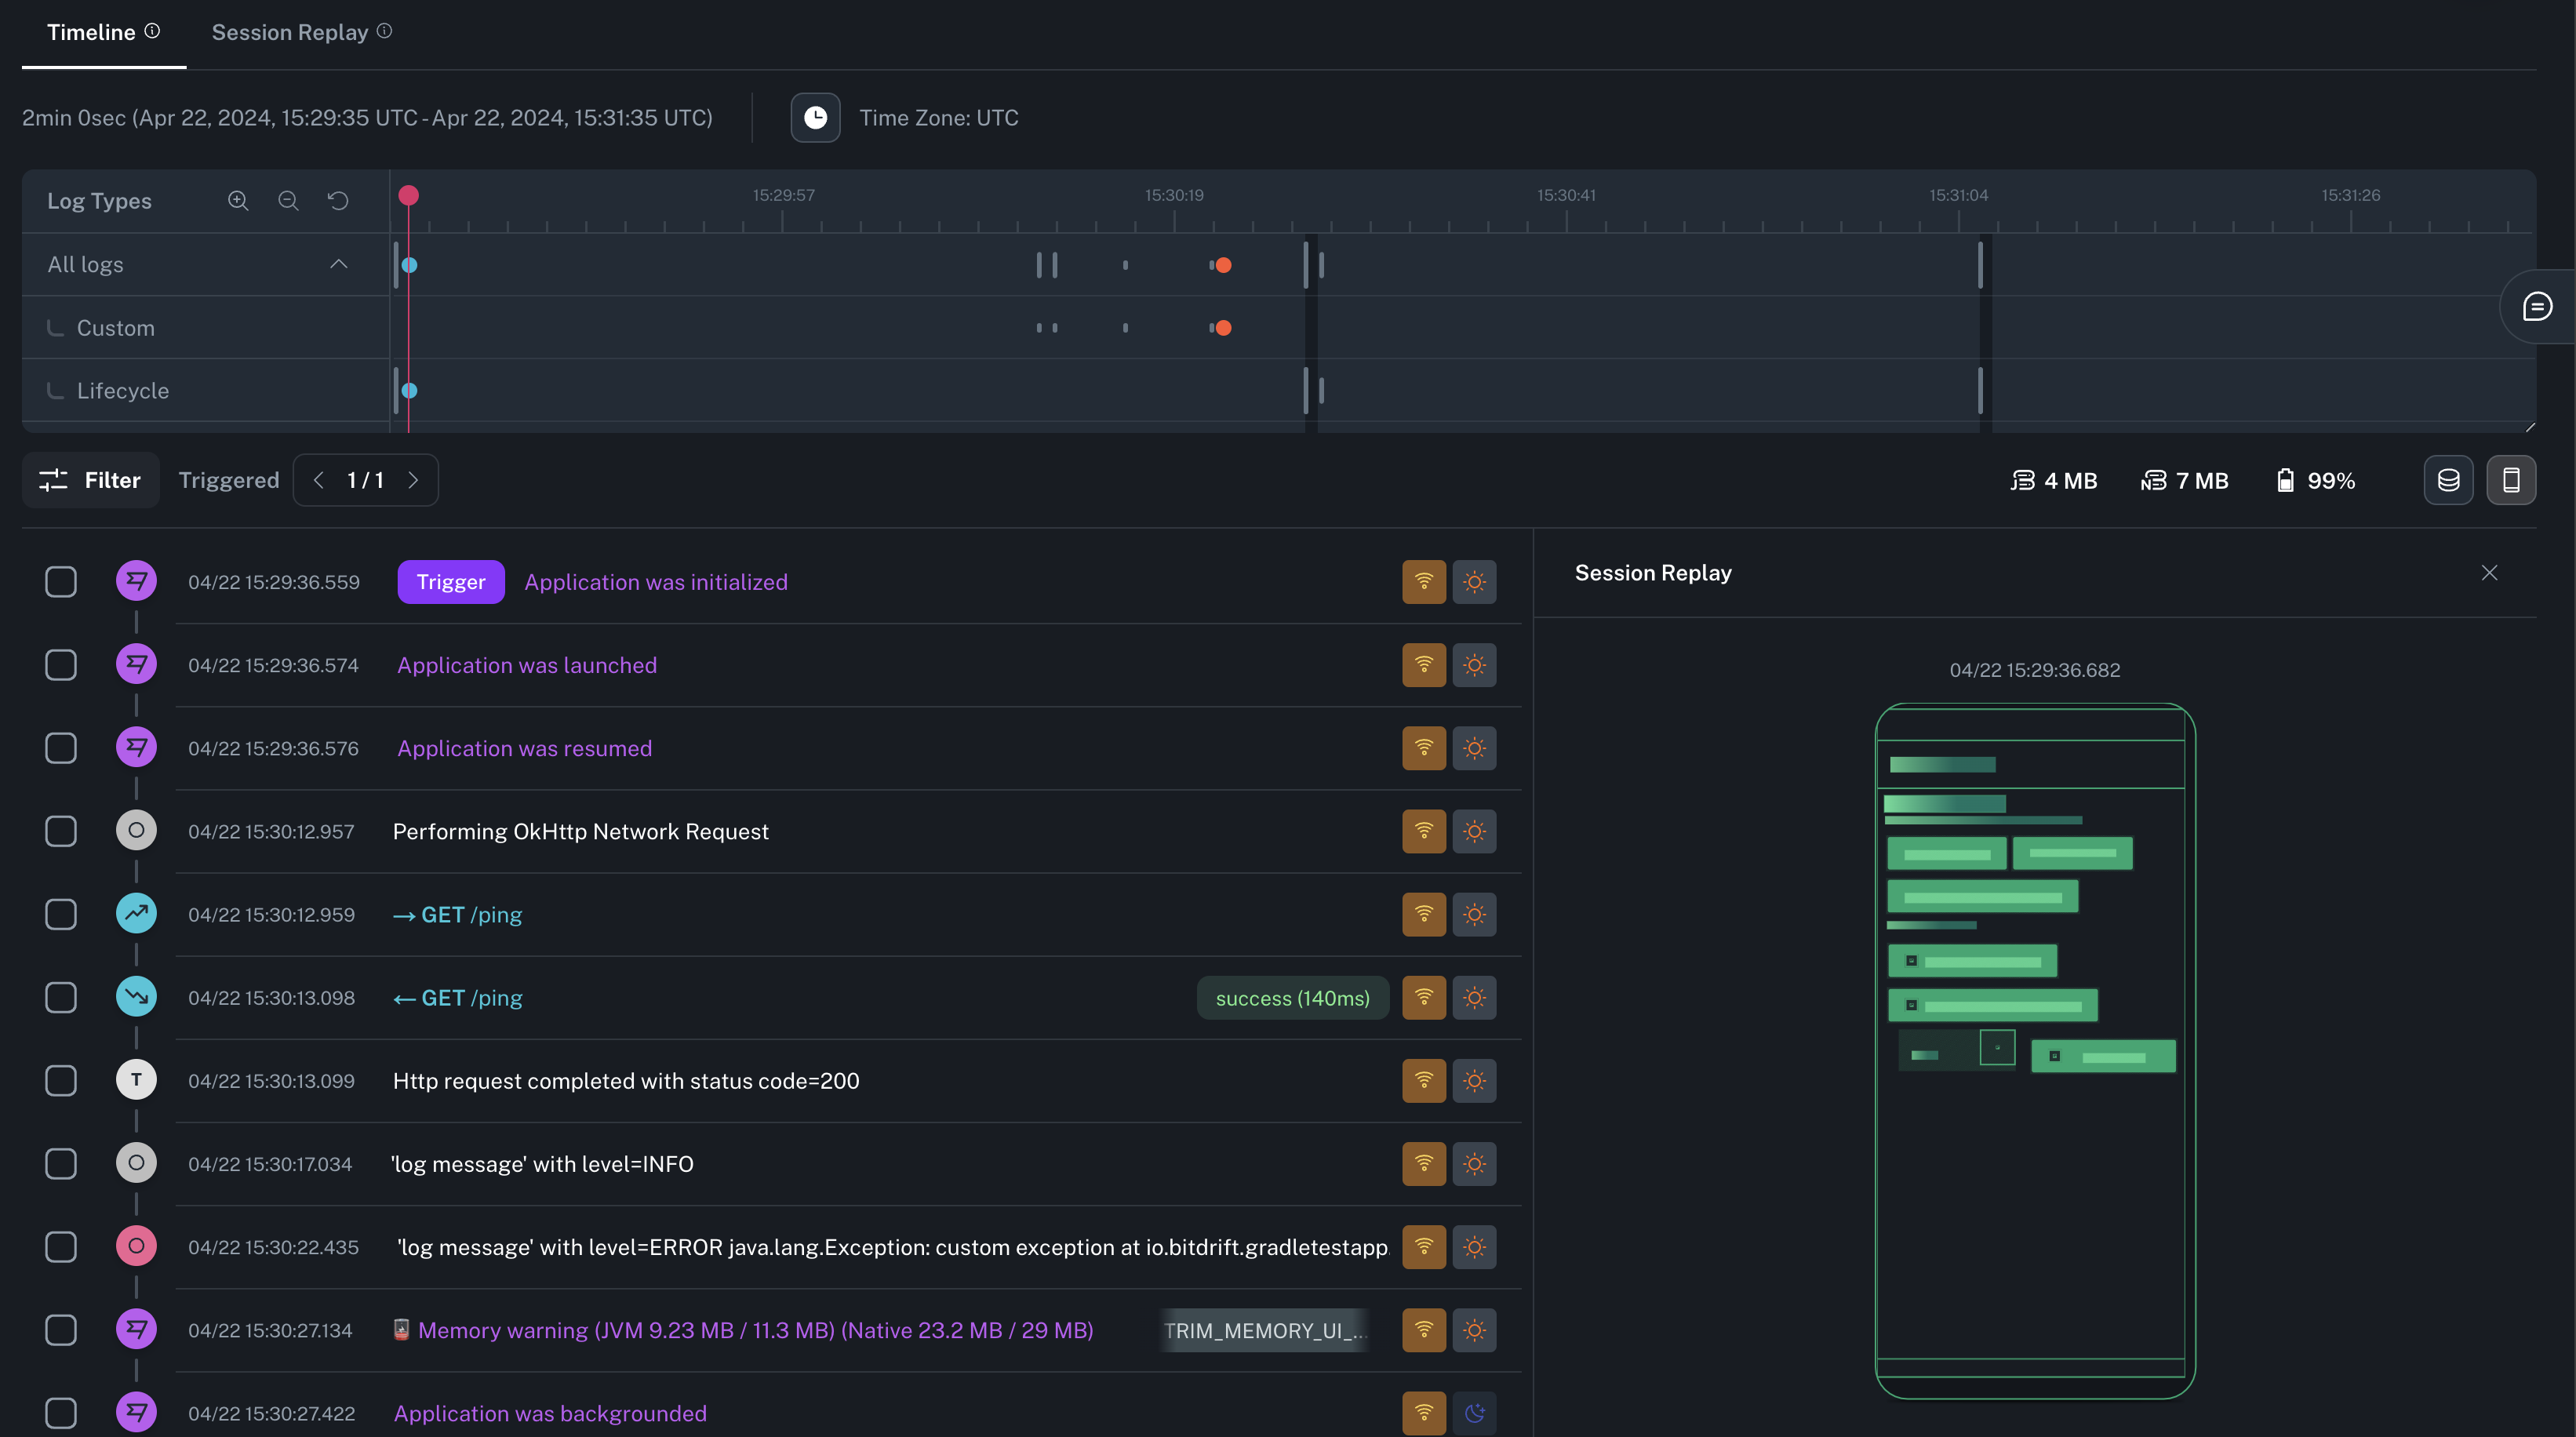
Timeline minimap gives you at-a-glance view of the entire session —even if a session spans tens-of-thousands of logs.
The minimap shows you activity volume broken down by different log types and app background/foreground state. The interactive scrubber (marked in red) follows as you scroll and allows you to quickly jump to specific parts of the session or selecting certain portions of the time continuum to zoom into that specific section. Zooming can also be done via the zoom controls on the top left corner.
Event Logs
The individual log lines emitted throughout the session are shown in a scrollable list in ascending order based on the log’s timestamp.
Info
Read the automatic instrumentation section to learn more about all the types of instrumentation supported.
Each of the log lines contains the following information:
- Log type (icon): Custom log category with special color and iconography (e.g. App Lifecycle, Device State, Networking).
- Timestamp: Time in which the log event occurred (displayed in selected Time Zone).
- Formatted message: Custom formatted preview string that provides a concise representation of the log. If no custom formatting is available, we fallback to showing the raw log message.
- Connectivity (icon): Type of network connection for mobile device in use at the time the log was recorded.
- Foreground/Background (icon): Whether the app was in the foreground or the background when the log was recorded.
- [Optional] Custom information (badge): Extra information related to the log message.
- [Optional] Trigger (badge): Whether or not this log was associated with a Workflow flush action, resulting in logs being uploaded.
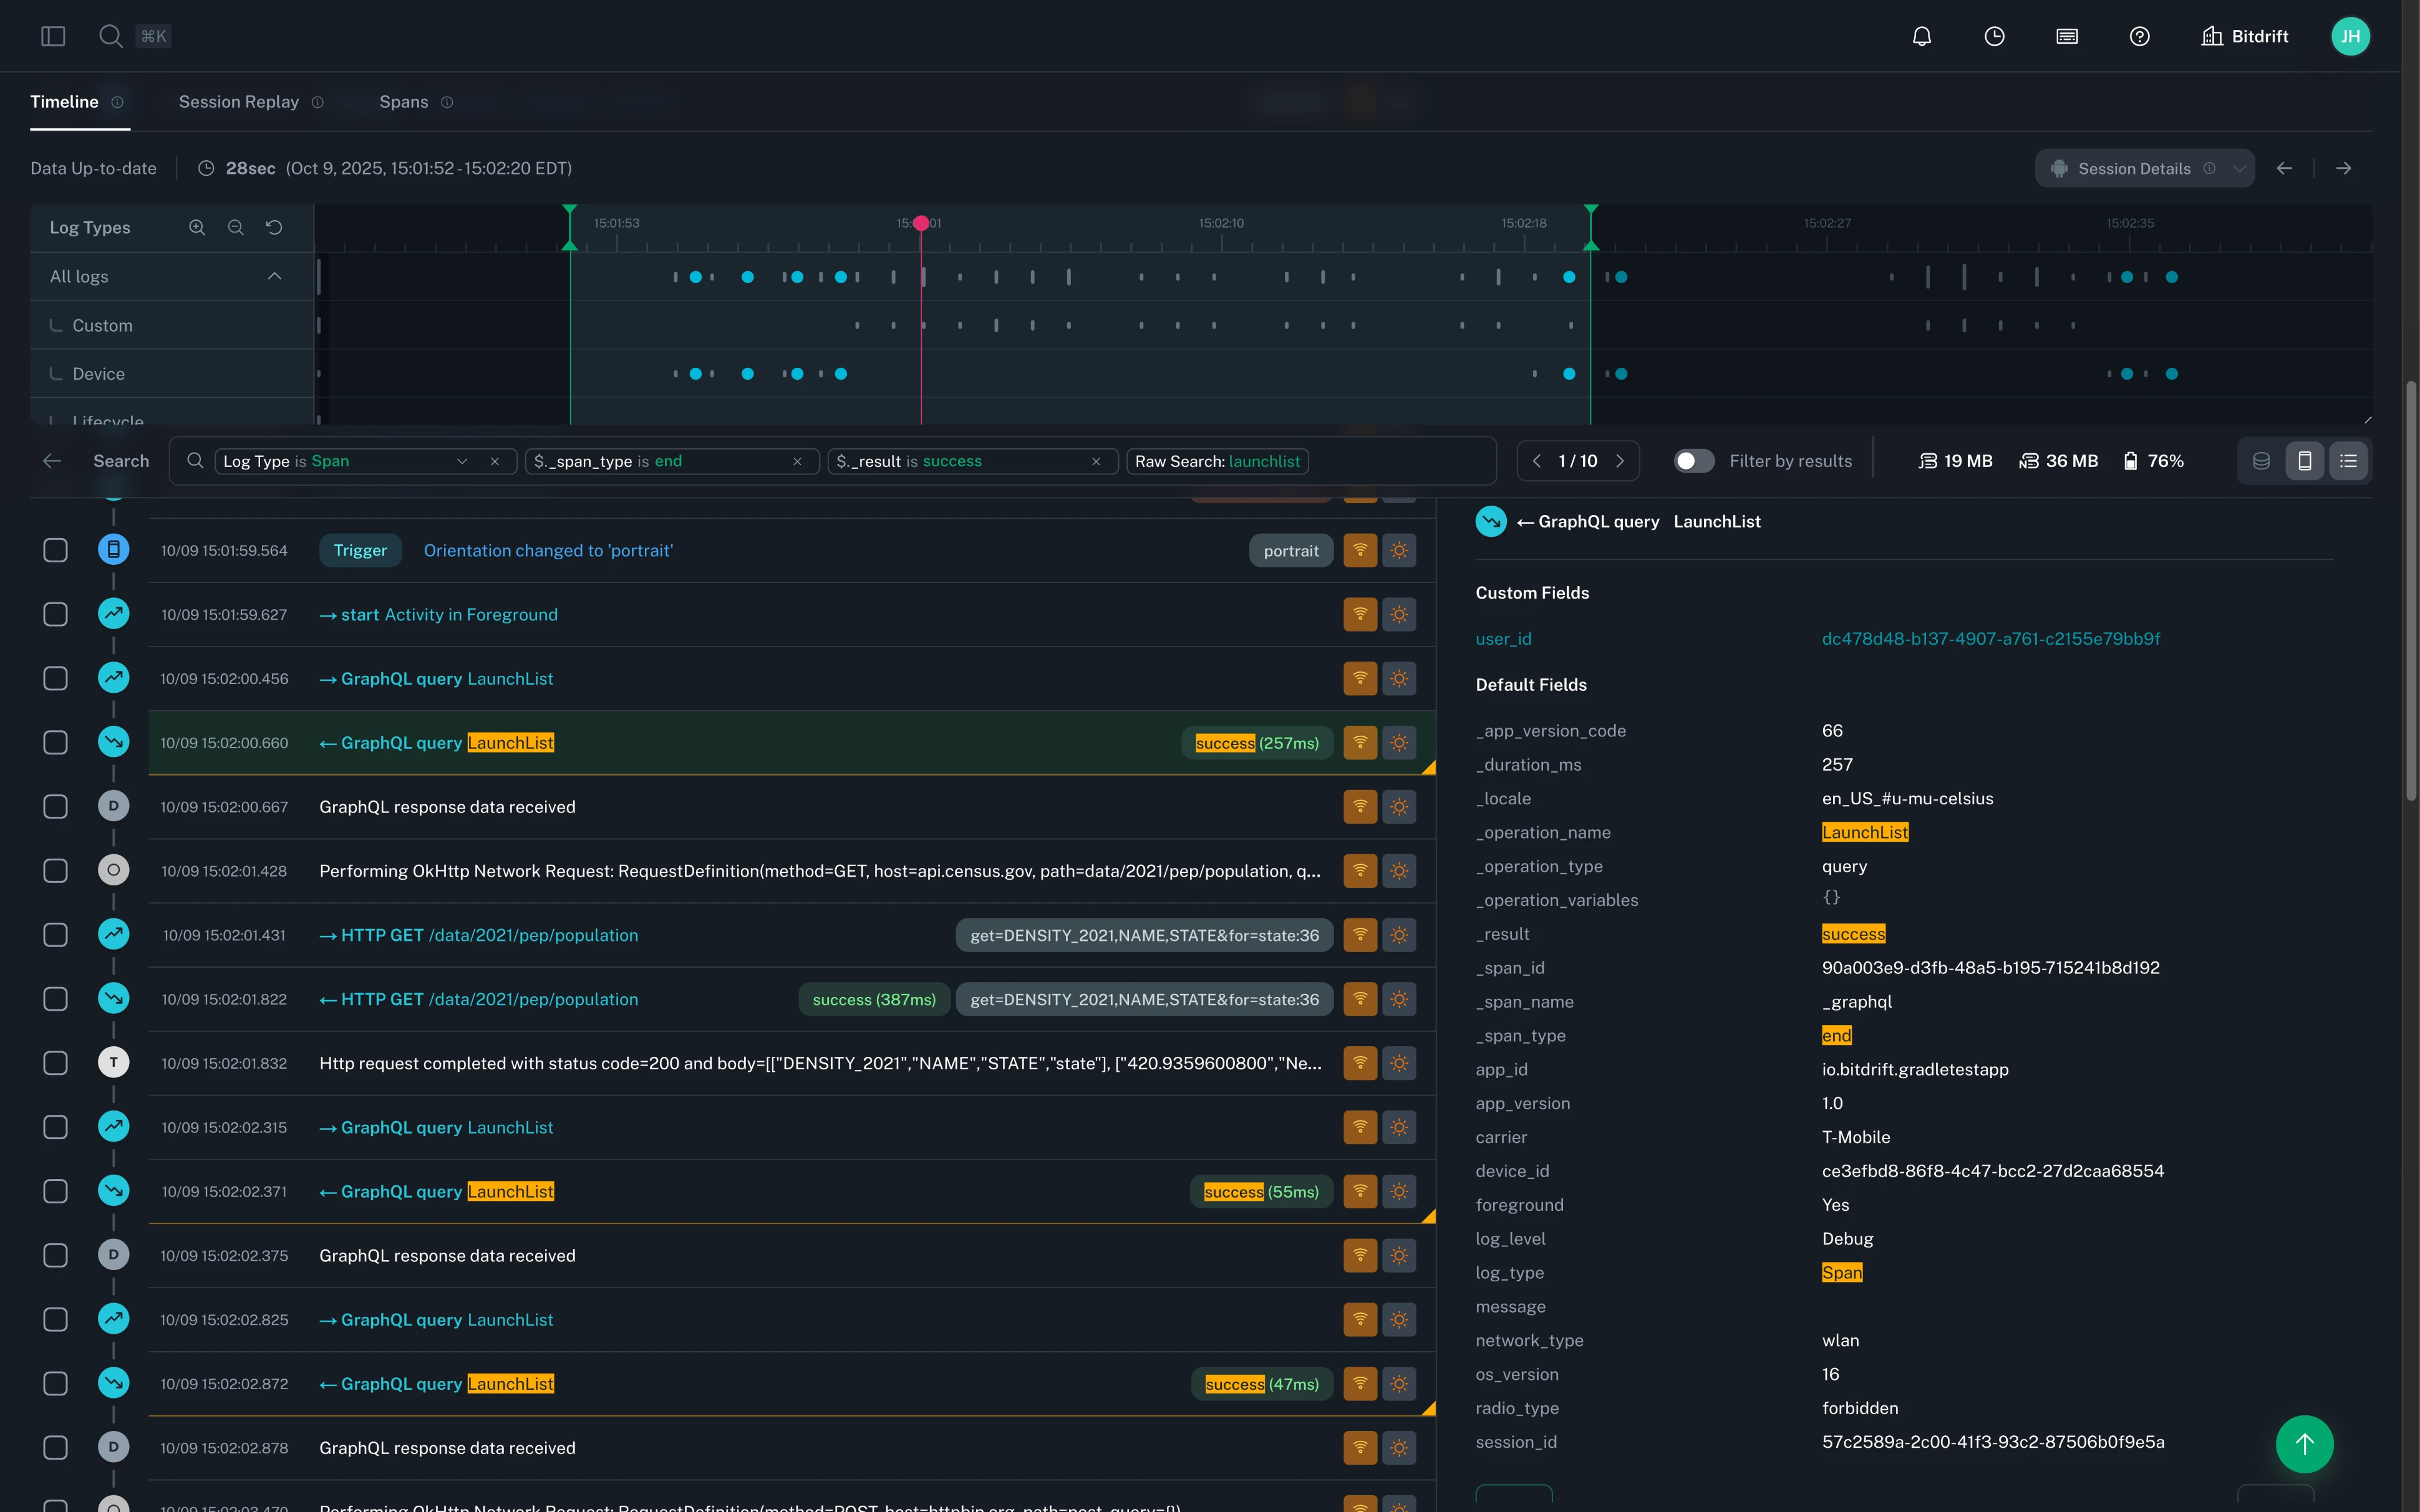
Selecting an individual log line allows you to see additional log details, including key/value parameters included with that log statement.
Highlighting and sharing
Highlighting allows you to mark/flag many individual log lines of importance. This is especially useful when you want to share multiple notable log entries within a given session.
To highlight a new log, select the box to the left of the log’s timestamp. Repeating this action will un-highlight an individual log entry.
Highlighted logs can be shared through the URL. After highlighting logs, copy the URL in your browser’s address bar. When someone opens this URL, the session will be loaded with those logs highlighted (in the same order they were originally highlighted).
Searching/Filtering
Searching the timeline allows you to quickly find specific logs by entering keywords or phrases in the search bar located at the top of the timeline view.
- Raw search: Enter keywords or phrases to search across all logs. This broadly matches against the log, including: log field values and names, log body, as well as prettified display text and extracted tags.
- Log Level: A search with preset log level options (e.g. Error, Warning, Info, Debug).
- Log Type: A search with preset log type options (e.g. Lifecycle, Device, Span).
- JsonPath: Advanced search using a subset of JsonPath syntax to filter logs based on specific key/value pairs within the log's data.
Tip
With JsonPath, deeply nested fields can be accessed using dot notation. For example, you might match against a nested payload field like $._custom.payload.user.id. Array elements can be accessed using bracket notation, such as $._custom.items[0].name to match against the name of the first item in an array.
Warning
Our JsonPath support is limited to features compatible with SQLite. For more information, refer to the SQLite documentation.
These search options can be combined to create more complex queries. For example we have preset searches for common use cases like "Network Error", which combines a Log Type of "Span" with queries against $._span_type and $._result.
In addition, you can choose to limit the scope of the timeline session by clicking and dragging on the minimap to select a specific time range of interest. This will filter the logs shown in the timeline to only those that fall within the selected time range.
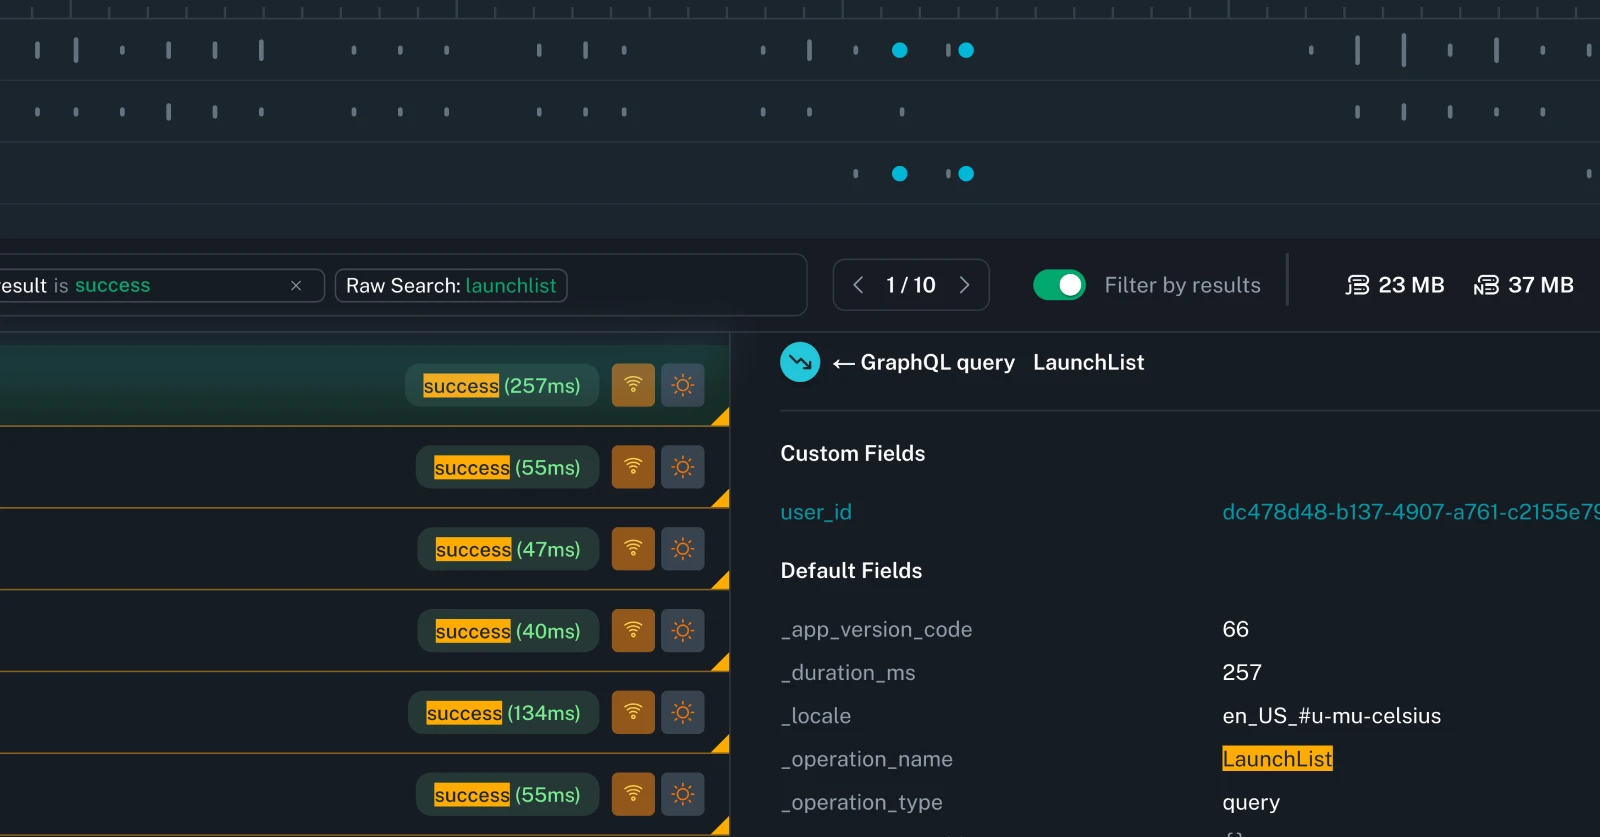
Finally, if you want to limit the session to view only search result matches, you can toggle the "Filter by results" option next to the search bar.
Changing timezone
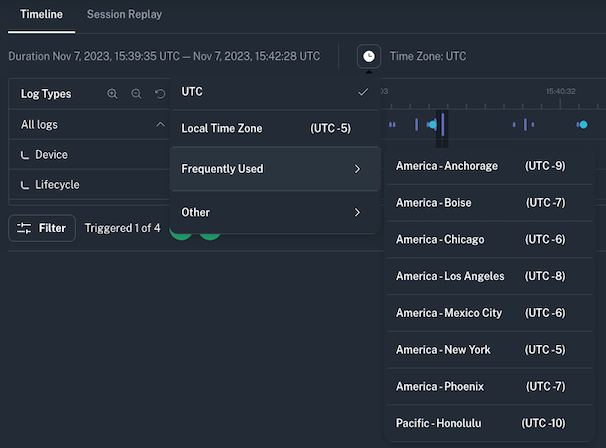
bitdrift Timeline defaults to using UTC as the timezone. Within a session view, you can change the timezone globally to your local or any other timezone to make it easier to reconcile other data you might be correlating.
Session Replay
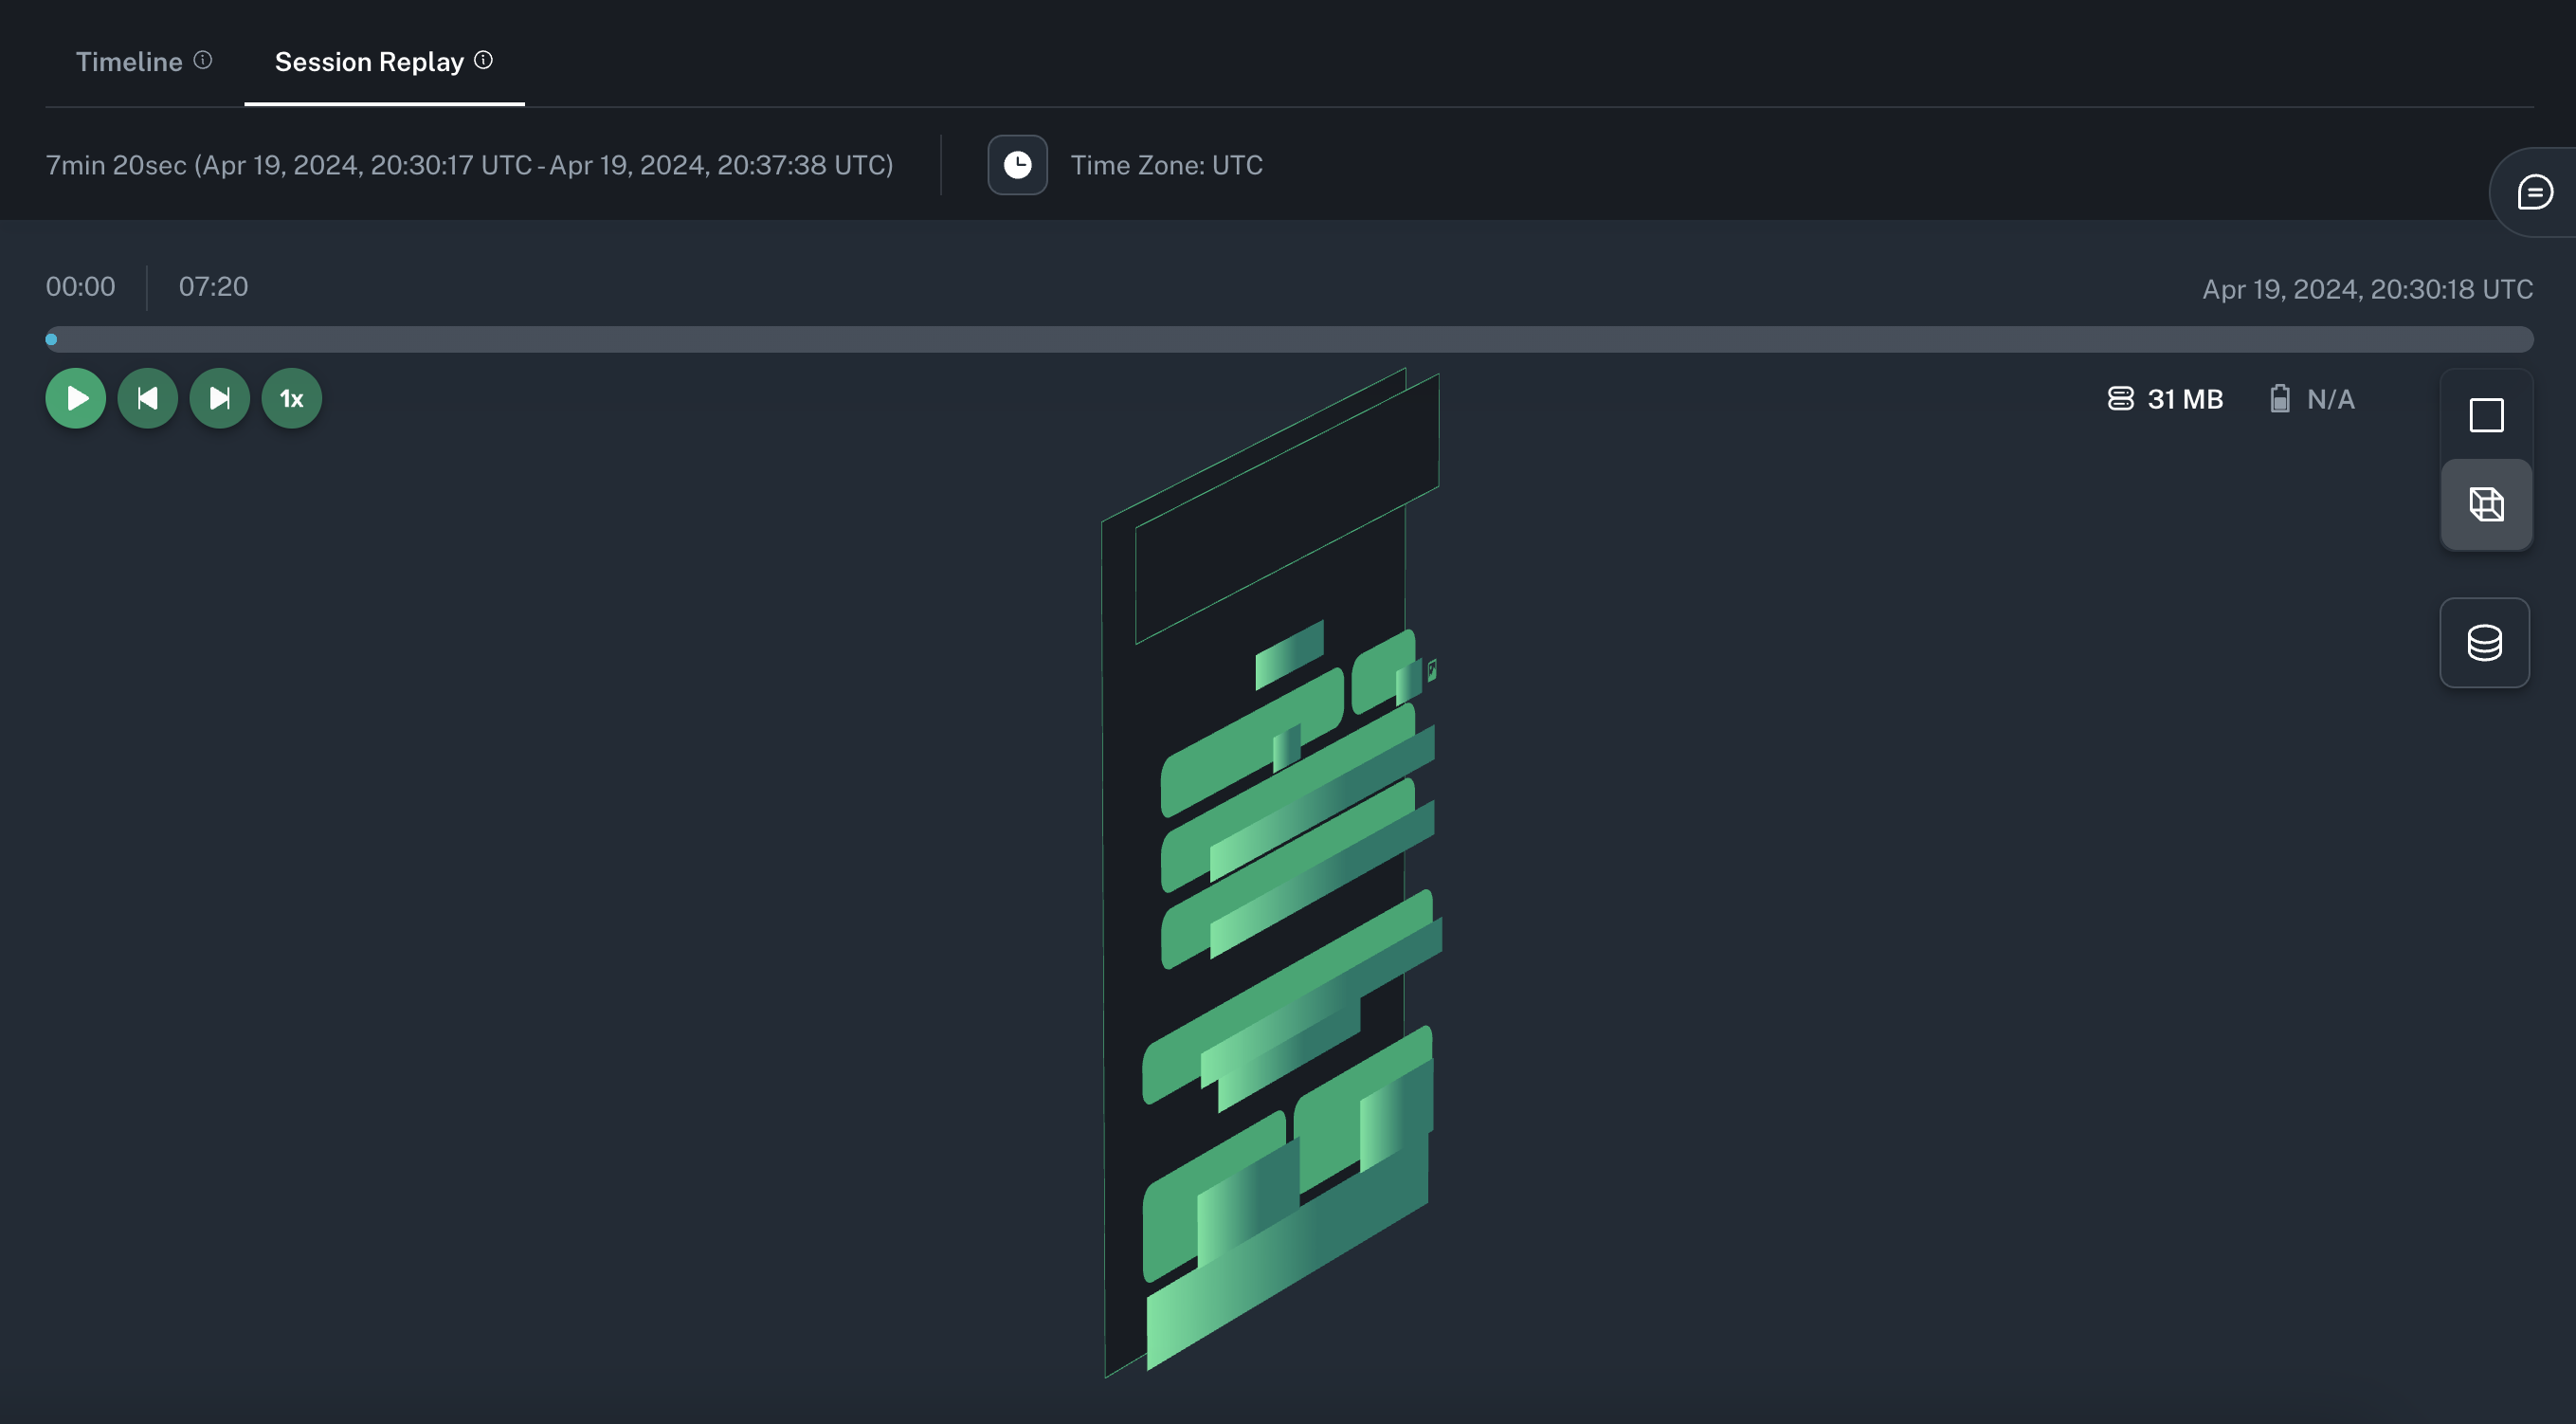
Session Replay allows you to visualize a lightweight representation of a session as the user experienced, along with the correlated timeline entries.
You can toggle the Session Replay side panel at any time by clicking on the mobile device icon on the upper right corner of the Timeline.
Playback and 3D view
You can access a full screen mode of Session Replay by clicking on the tab on top of the Minimap. This will allow you to play a video-like reproduction of the screen changes. Clicking the 3D icon on the right will allow you to see and control all the layers of the screen's layout.
Info
See the SDK Session Replay section for information about how to configure this feature.
Resource Utilization
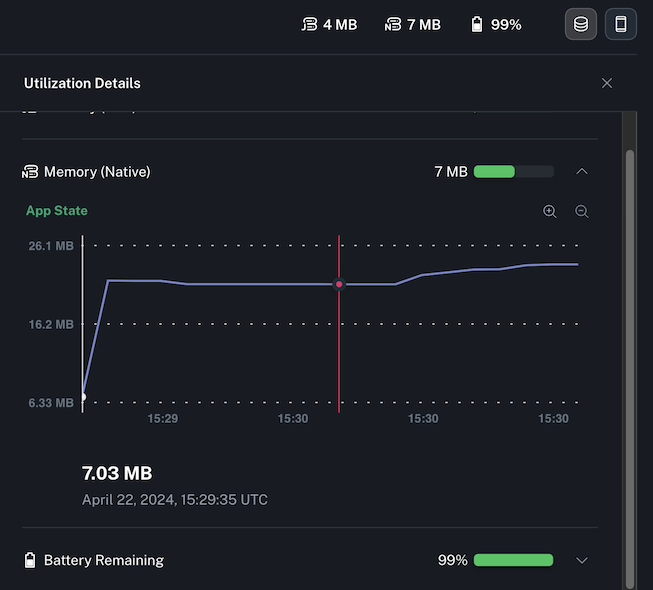
In order to see memory and battery consumption information, you can toggle the Resource Utilization panel by clicking the icon on the upper right corner of the Timeline.
The data displayed in the panel will update as you scroll or advance the session to reflect the state of the device at any point in time.
Info
See the SDK Resource Reporting section to learn more about this feature.
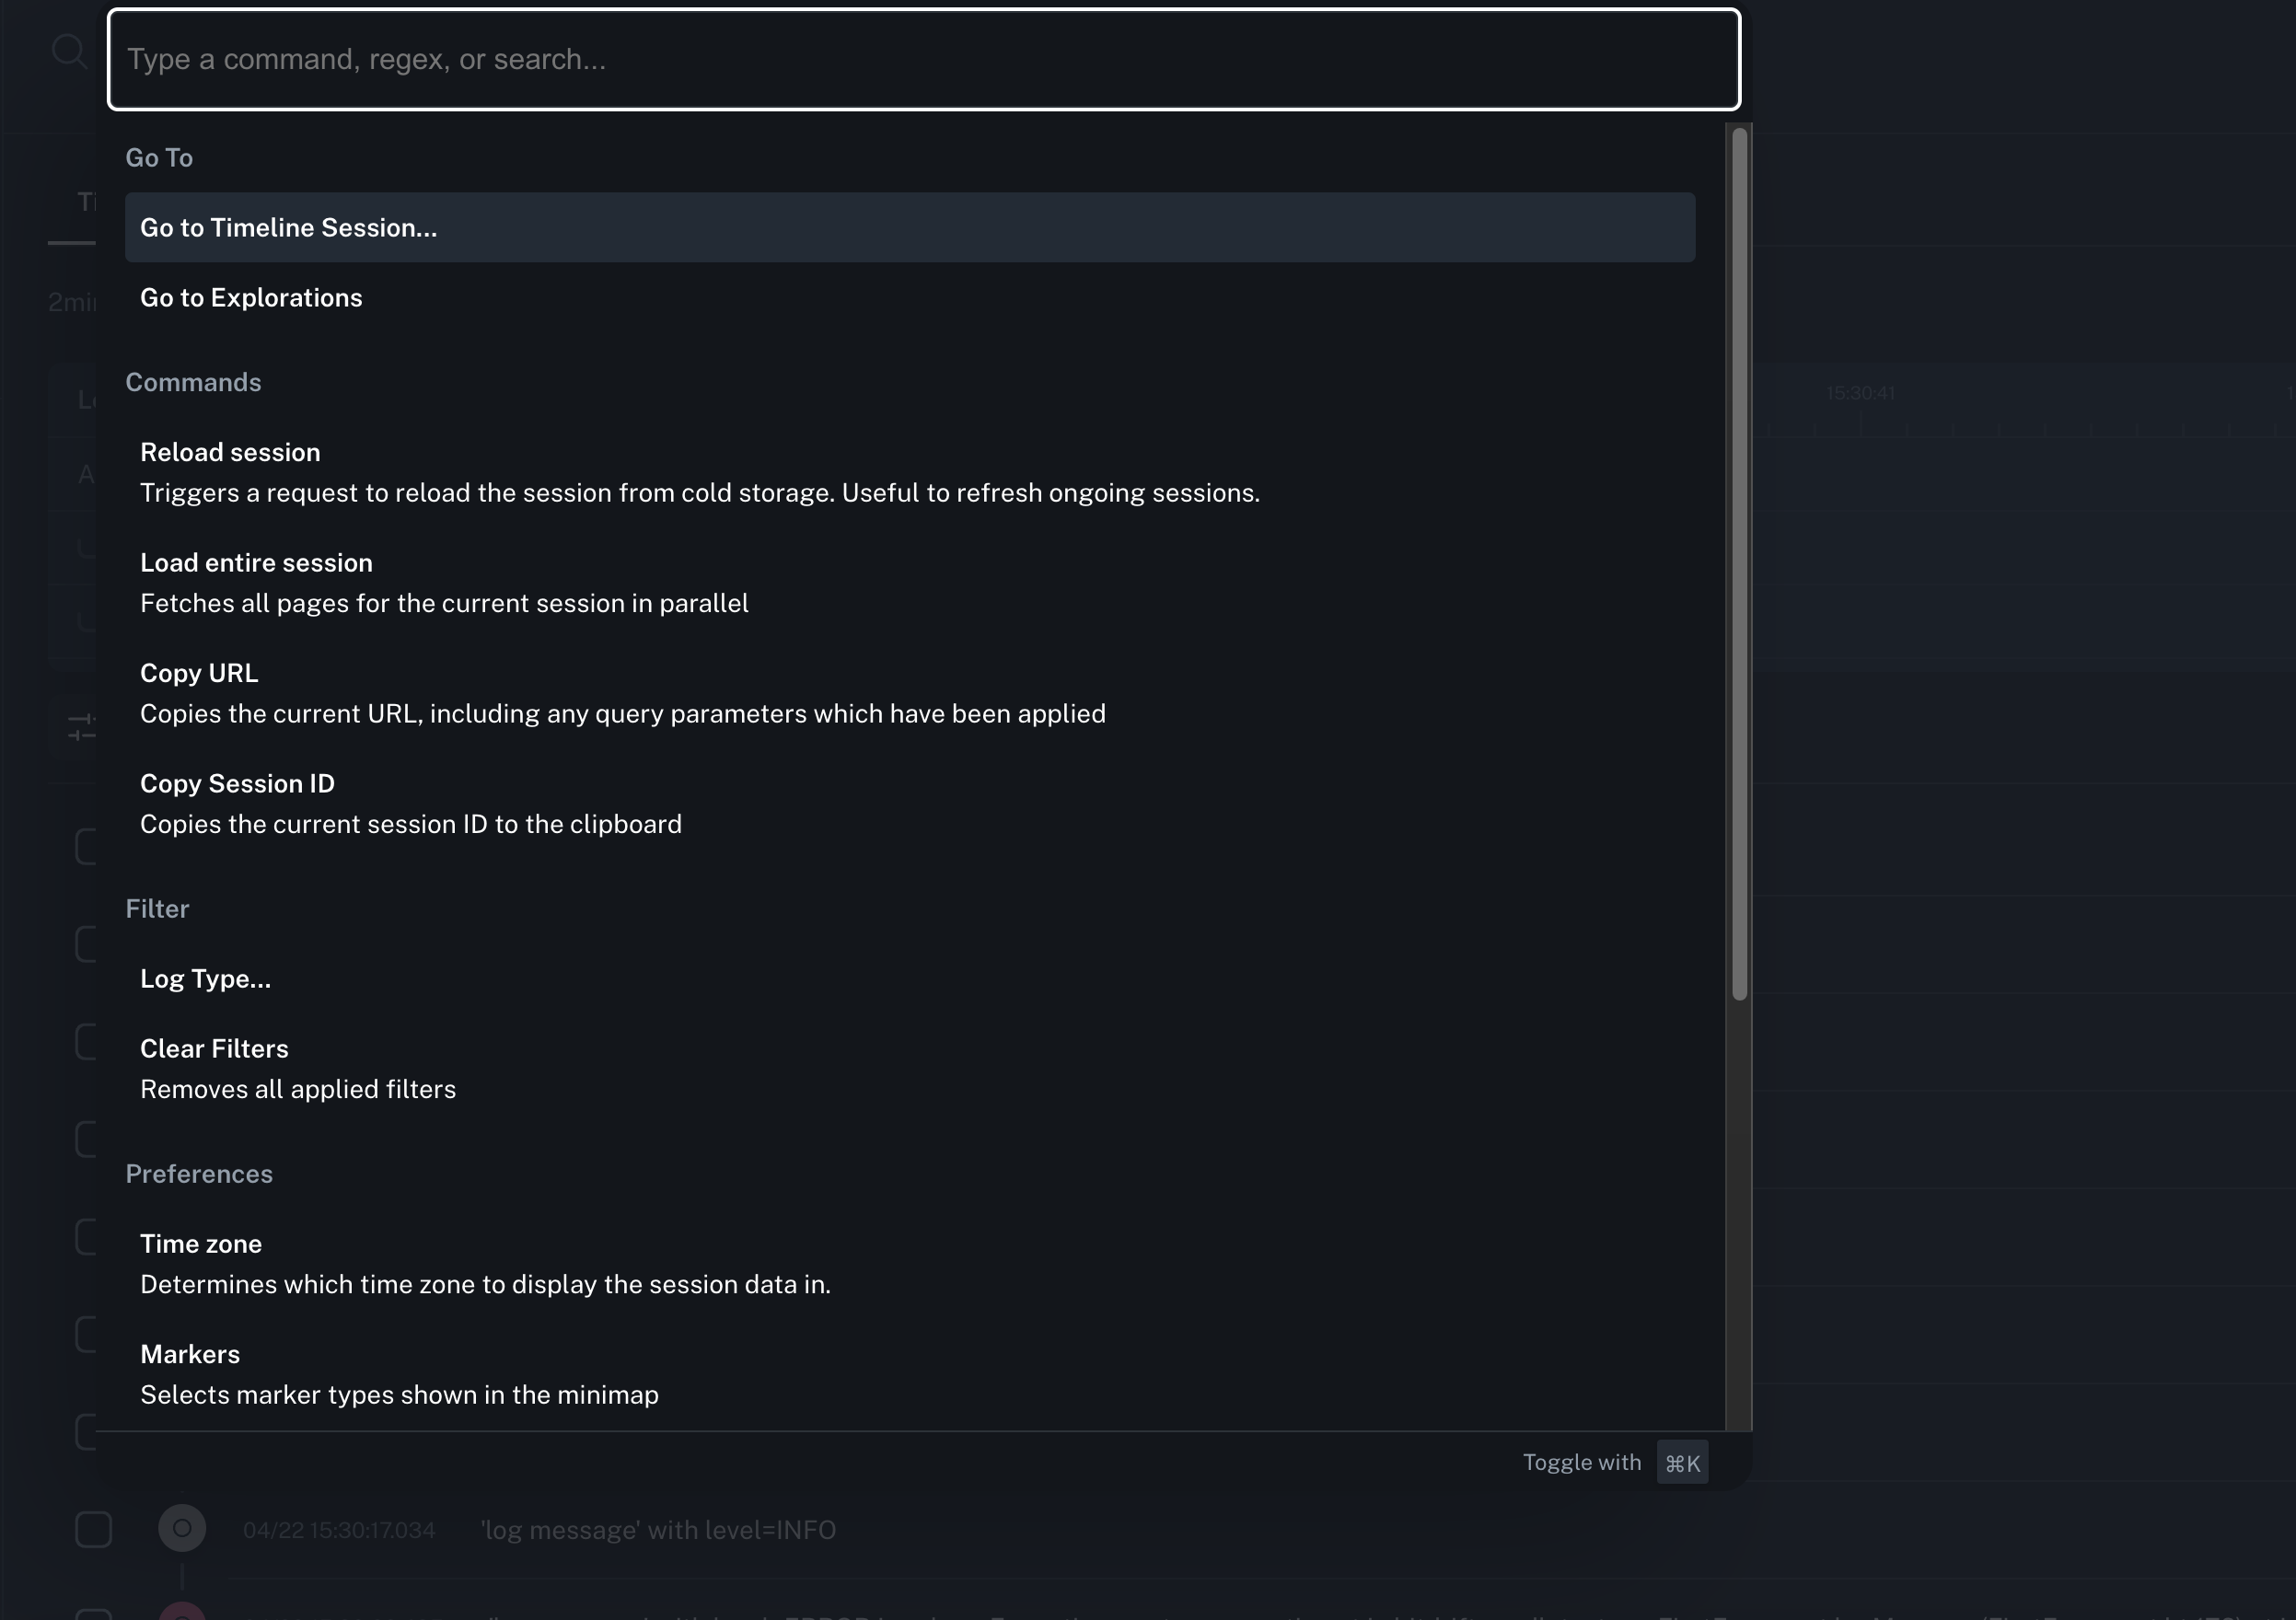
Command Palette
The command palette is a panel which gives you access to shortcuts to frequently accessed areas (e.g. navigation, search, filters).
Tip
Access it using ⌘ + K
Spans Visualization (Waterfall)
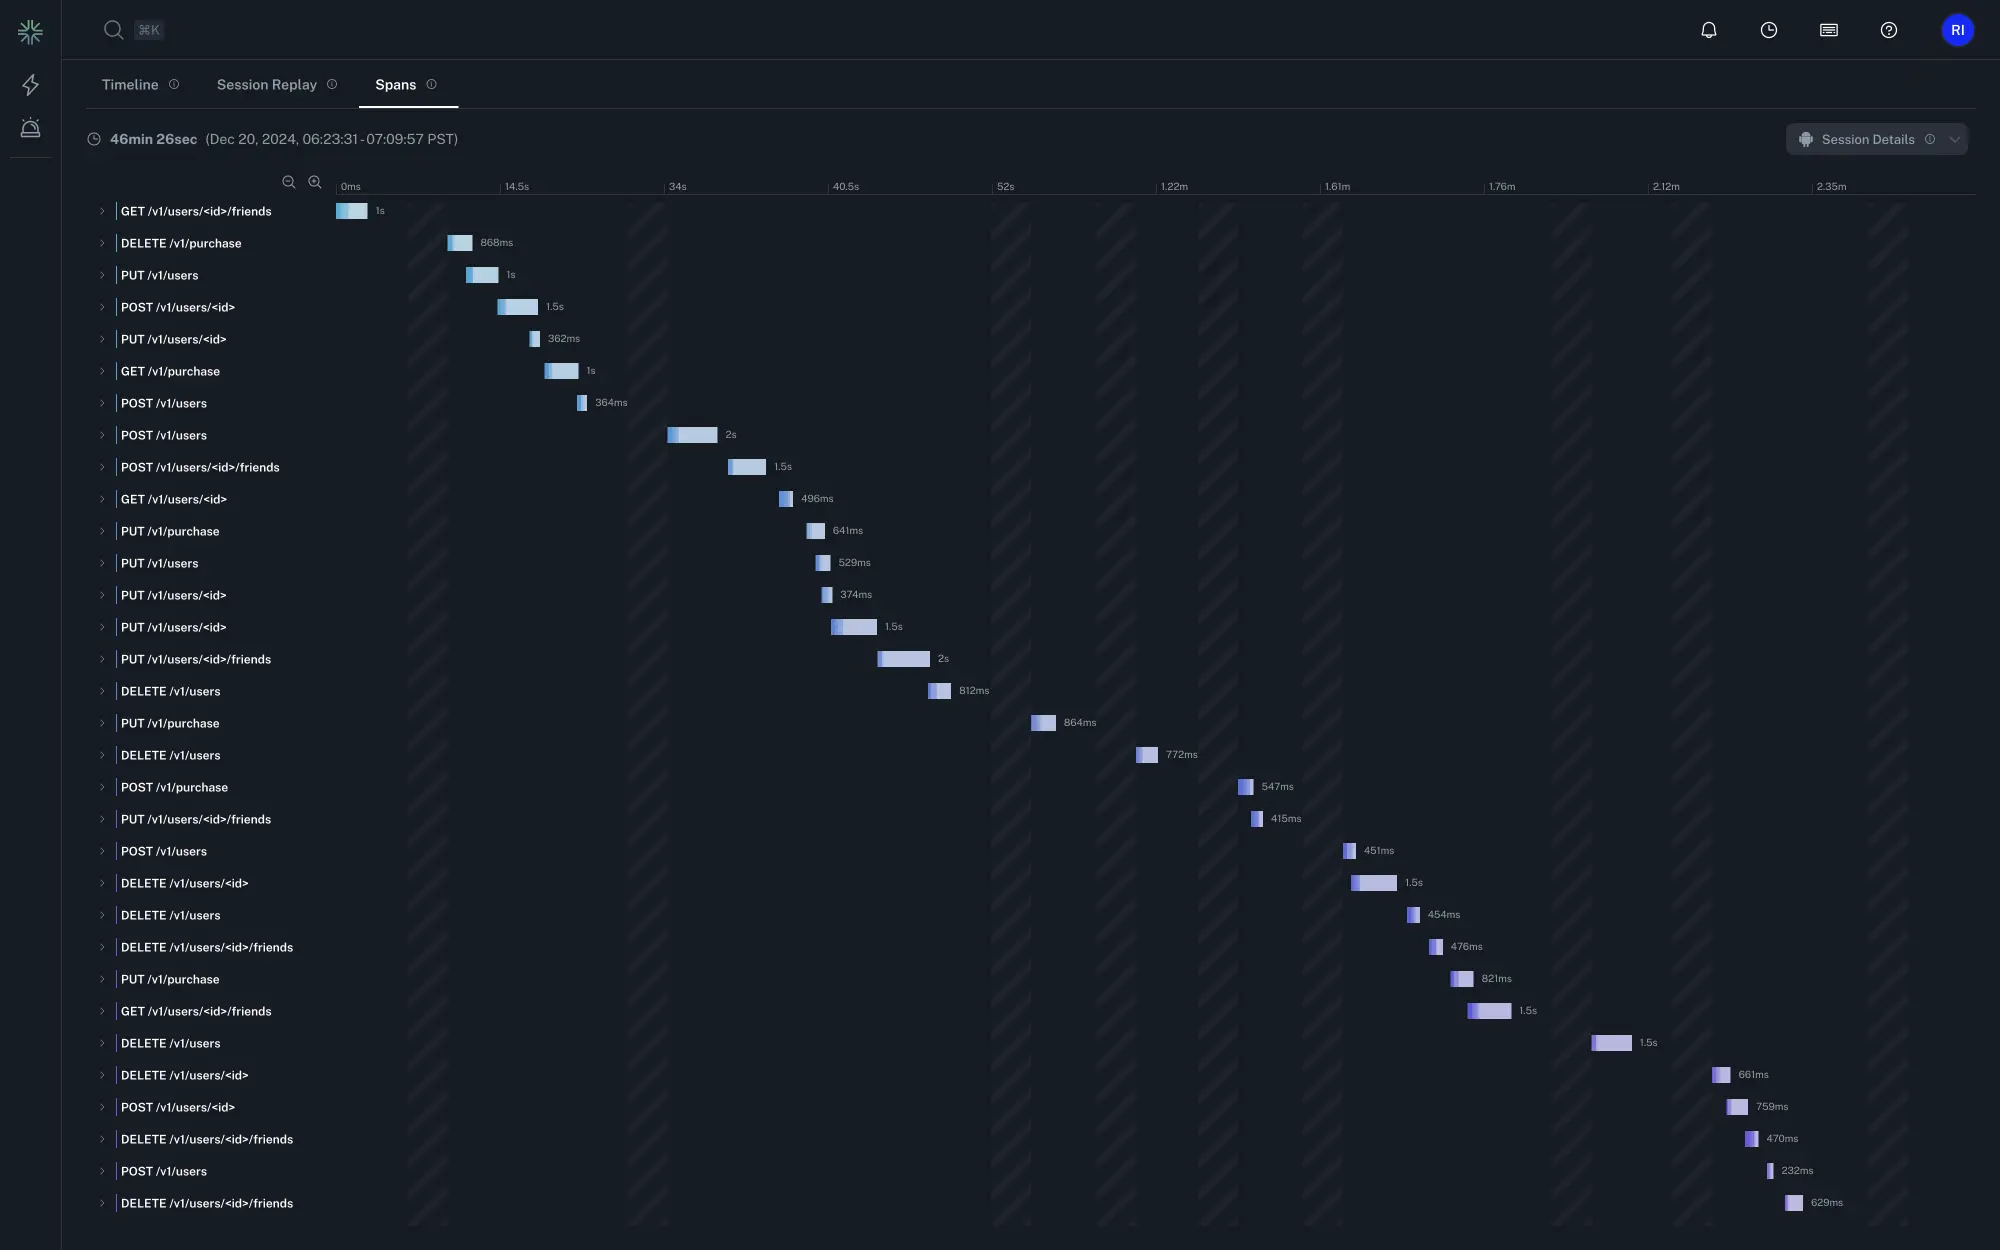
The Waterfall chart presents spans in a hierarchical view using a Gantt-style format. This makes it especially helpful for analyzing the performance of specific parts of your application, like network requests, database queries, and other time-consuming operations.
The chart displays both custom spans you define in your code and those automatically generated by the SDK. Spans are nested beneath their parent spans, and you can expand or collapse them to explore different levels of detail.
Info
See the SDK Spans section for information about how to configure this feature.
