Workflows: Feature Guide
Core Concepts
- Exploration: A container that groups a collection of workflows.
- Workflow: A series of match conditions that logs will be evaluated against, and a series of actions to perform.
- Match: A condition that can trigger an action based on matching against the contents of a log.
- Action: The action to perform and its associated visualization widget.
See the included Workflow Examples to get started right away.
Workflows Exploration View
Workflows provide a structured framework for defining conditional logic that enables dynamic collection of data on mobile devices.

Explorations
Explorations are a way to organize workflows. Simply put, they are a place to group related investigations or "explorations". They have a Title, and can be deleted at any time.
Warning
Deleting an exploration will stop and delete any workflow it contains.

Note
When creating an Exploration, an Exploration Report will be automatically created. It will collate all the outputs, from all the workflows, that are part of an Exploration.
Workflows
A workflow represents a graph that consists of match nodes and action nodes. The mobile SDK continually processes incoming logs and aims to advance any active workflows. As logs are received, they are compared against the ongoing match conditions for each workflow. If a match is found, the relevant action is triggered, and the workflow progresses to its subsequent state. In the case of a terminal node, the workflow returns to its initial state.
From the perspective of a single workflow, this implies that it outlines a sequence of 'steps' that logs must follow to execute the intended actions. A workflow can only have one starting match condition, but it can then branch out to evaluate many conditions and execute many actions. Every terminal match condition should have attached at least one action for a workflow to be considered valid.

Workflow Lifecycle
As workflows are first sent to the clients, they are in an inactive state, waiting for the client to process a log that matches any of workflow's initial state conditions (i.e., any of the match conditions that connect to the start node). Once an initial match is found, the workflow becomes active within the branch of the workflow that matched. If multiple branches match the same event, multiple clones of the workflow will be concurrently active.
While the workflow is active, the SDK continuously processes logs to see if it can progress any of the active workflows and also checks if the initial conditions for a workflow are met. The SDK first considers any progress that can be made based on the log that was just received, and progresses the workflow if possible. If no progress has been made but the initial conditions are met, the workflow is reset and then progressed based on the log that matched the initial conditions.
Workflows continue to progress until they reach a terminal state (i.e., no further matching can be done), at which point they will be reset and wait for the initial conditions to be met again.
Workflows are also reset as part of the session lifecycle. When a session ends, all active workflows are reset.
Sharing and URL Slugs
To share a workflow, you can simply copy and paste the full URL. The workflow URL is created using slugs, which are formed by combining the workflow's title with a unique ID. A slug is the part at the end of a URL that makes it easy to identify a specific page on a website. If you edit the title, the URL slug is automatically updated to match the change. Importantly, both the old and new URLs will still work after the update.
Start Node
All workflows begin with a start node. This node is added to all created workflows and cannot be deleted. The start node is the entry point for logs to be processed by the workflow and allows for the definition of multiple entry conditions for the workflow. The start node is neither a match nor an action node, but a way to connect multiple initial match nodes.
Match Nodes
A matcher is a 'step' in a workflow. Each step is activated upon the processing of a new log that meets the specified criteria. Match conditions are split into two categories:

Default Events
These are match conditions tailored for events emitted by the SDK by default or via other integration points. As these are well known events, the UI offers various built-in options for these types of matchers.
Read the SDK > Log Events section to learn more about the automatic instrumented logs.
Generic Match
These match conditions apply to any log line sent to the mobile SDK, enabling the addition of matchers that target logs not initially provided by the mobile SDK, such as custom instrumentation incorporated in user code.
Read the SDK > Custom Logs section to learn more about instrumenting your app.
Match Conditions
A condition is defined by a series of logical ANDs and ORs that are used to match the log body, log fields and exposed feature flags. If the condition evaluates to true then the node first executes any attached actions and then advances to the next match conditions if any.

The field list is pre-populated with the attributes automatically attached to every log by the SDK. The matching operators support text matching (exact, negation, regex), numeric matching (equals, greater than, lesser than), as well as wildcard matching. The regex matcher is not a full regex match; it matches as long as a pattern occurs anywhere in the string. For example, the regex "foo" matches the message "foobar".
If desired you can limit your matching logic to a specific platform using the tab selector (iOS / Android).
Read the SDK > Default Fields section to learn more about the automatic instrumented fields.
Feature Flag Exposure
When a user is exposed to a feature flag via the SDK > Feature Flags Feature, a state change event is processed by the workflow engine. This works much like matching on a log can read exposed feature flag values as well as globally set fields. This event is guaranteed to be processed before any logs observe the feature flag through its match conditionals.
Timeout Matcher
The Timeout Matcher allows workflows to progress based on inactivity, when no log matches occur within a given timeframe. This enables a powerful class of investigations focused on understanding what didn't happen, such as abandoned onboarding flows, stuck network retries, or moments of unexpected inactivity.
To add a Timeout Matcher, connect it after one or more existing match nodes. The Timeout Matcher will begin counting down after the preceding node is matched. If no further matches occur along any of the forward paths within the configured timeout duration, the Timeout Matcher activates.
Info
Timeouts measure time in wall-clock time from the moment the preceding match node was triggered. If another match node is hit first, the timeout is canceled.
Example use cases
- A user reaches the phone verification screen but doesn't verify their number within 10 minutes.
- A screen view is shown, but no user interaction is logged after 30 seconds.
Timeout Matchers are represented visually in the workflow graph and support attaching all regular action types, such as Record Session, Plot Chart, and Create Funnel, just like any other matcher.

Tip
Timeout Matchers can be combined with looping matchers and dynamic spans to observe sequences where the absence of activity matters just as much as the presence of it.
Measure time between matching nodes
Connecting two matching nodes by its "measure time" connector allows you to measure the time between the two nodes. This is useful for measuring the time between two events, such as a network request and its response.
Dynamic spans are created by selecting two existing log points (start and end), and bitdrift will automatically compute the duration between them. This feature is designed to make performance analysis much more agile: rather than waiting for a new build to add instrumentation, you can immediately start measuring the parts of your app that matter most. By working with the data you already have, you can quickly identify latency issues, regressions, or performance bottlenecks—even across asynchronous or distributed workflows.
Under the hood, dynamic spans behave just like regular spans: they show up in waterfall views, support metadata, and can be filtered or searched. This makes them a first-class tool for both ad-hoc investigations and long-term monitoring, without additional engineering overhead.

Version Matching
To ensure intuitive matching of app and OS version attributes, version-specific matchers that support comparison and wildcard operators are provided.

Non-equal Comparison Operators
For the operators >=, =<, >, and <, the comparison works as follows:
- The portion of the version string after the first occurrence of either '-' or '+' characters is ignored.
- The rest of the string is split by the "." character, and each component is compared separately from the first one to the last one, until they differ or there are no more components. The components are compared as integers if both sides of the comparison operator can be parsed as integers (the string "01" is parsed as the integer 1); otherwise, string lexicographic order is used.
Wildcard Operators
The wildcard operator works as follows:
- All characters entered, except for an asterisk character (*) and question mark character (?), are treated as literal characters.
- Question Mark Character (?) stands for "match exactly any one character here."
- Asterisk Character (*) is the matching wildcard. It means "match any zero or more characters here."
- The operator matches only if the version string fully matches the provided pattern.
The "not wildcard" operator is the negation of the wildcard operator described above.
Custom Fields
It also possible to evaluate a condition against any of your custom fields. Click the {} brackets icon inside a Generic Match to manually input the field name.
Read the SDK > Custom Logs and Global Fields sections to learn more about sending your own custom fields.

Action Nodes
When a workflow progresses and reaches an action, data is collected on the client and can be viewed through widgets on the explorations page. These are the supported types of actions:

Record Session
Create a list of sessions by attaching a record session action on any matcher node. This action uploads logs related to the session at the point when the workflow reaches the action and continues to stream logs until the session changes1. Each Record Session rule leads to the display of a table widget in the workflow view, listing all sessions captured under this rule. Using this table, users can navigate to the timeline view, which presents all logged data within that session.

Read the Session Timeline Feature Guide section to learn more about the automatic instrumentation supported.
Plot Chart
A line chart can be created by attaching any number of matching nodes to a single plot series action. Whenever any of the matching nodes that link to a plot series action are hit, a counter is incremented. This counter is then used to generate a time series that can be viewed in the workflow view. For a single plot series action, a corresponding chart widget displays all the matching nodes that link into it as separate time series, labeled by the name of the connection between the matching node and the plot series action.

Multiple charts can be created within one workflow by having multiple plot series actions. Each plot series action can plot multiple series by having multiple matching nodes connected to it.

Tip
Use the date range selector on the top right corner to select a fixed or relative date range. For relative ranges, aggregation periods scale with the lookback range i.e.
- last 15 minutes has a 1-minute aggregation period.
- last hour has a 1-minute aggregation period.
- last 24 hours has a 15-minute aggregation period.
- last 7 days has a 2-hour aggregation period.
- last 30 days has a 2-hour aggregation period.
Enabling data segmentation

By default chart and session list data do not collect extra segmentation details such as OS, app version, app ID, etc. By selecting this toggle, extra segmentation details will be collected which currently include: OS, OS version, app version, app ID, foreground status, model, network type, radio type, and locale. This data will be used to power the aggregated insights view. If not selected the aggregated insights view will not be available. Turning on data segmentation will increase the amount of data sent from mobile clients and will lead to high metric cardinality and complexity of the collected data.
Advanced Mode
The Plot Chart action supports advanced data visualization modes. You can plot any numeric field from your log line and use the Group By option to create a separate plot line series for each field value or exposed feature flag.
We support 3 types of data aggregation: Count / Sum, Histogram, and Rate.
 |
 |
Count / Sum
Plots a chart where each data point represents the sum of the numeric value chosen as the Source Field. If * is selected, it will simply count each log occurrence.
By default, a single line is plotted. Selecting the Group By option switches the visualization to instead plot a separate line for each category—now supporting multiple group-by fields, allowing comparisons across several dimensions in one chart (up to 5 combinations).
All plot charts can now also be displayed in a table view, offering an alternate layout for easier data inspection and export.
Additionally, all newly created charts now track the number of unique devices contributing to each data point, as well as the total aggregate, enhancing insight into your user base.

Histogram
Plots a chart where each data point represents a percentile distribution of the numeric value chosen as the Source Field. By default, it computes 3 percentile values (p50, p90, and p99) and plots a separate line series for each. Selecting the Group By option switches the visualization to instead plot a separate line for each category, up to 5 values. You can choose which percentile you want to display in the dropdown.

You can also switch a histogram to a bar chart view to inspect the bucket distribution for a selected series and group-by value. The bar chart shows counts per bucket, includes the bucket range on hover, and surfaces the percentile position within the distribution.

Average
Plots a chart where each data point represents the average of the numeric value chosen as the Source Field.
The visualization and grouping options behave the same as with Count / Sum
Rate
Plots a chart where each data point represents the ratio between two numeric values chosen as the Numerator Field divided by the Denominator Field, expressed as a percentage. Additionally it displays the average percent value, as well as the change delta for the selected time period.

Tip
For charts which have a Group By set to a high cardinality field, such as request path, only the top series will be displayed. You can dig into the data by clicking the 'Customize Dimensions' button above the chart legend.
This allows you search for and select which dimensions to display.
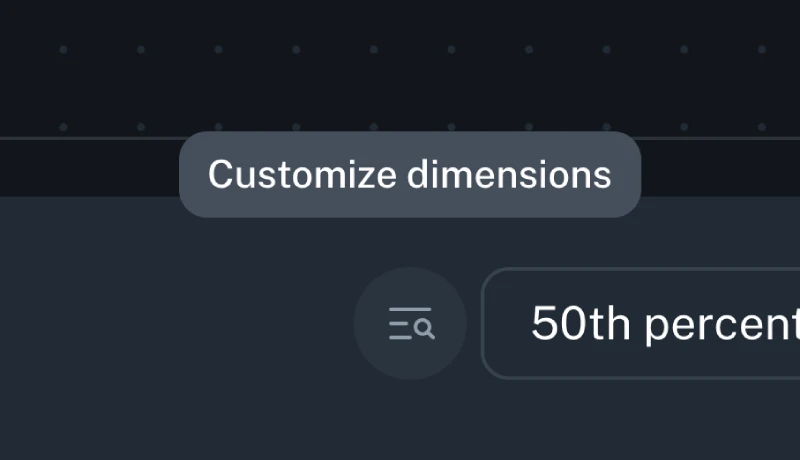
Table View
You can switch from a chart to a tabular representation of the same data by selecting the chart icon > Table view in the top-right corner of a chart.
The table view shows aggregated statistics for the selected time range. The columns shown depend on the chart type and configuration. Aggregation windows influence the calculated values (such as Min and Max).
Table columns by chart type
(Columns shown in square brackets appear only when configured.)
| Chart type | Columns shown |
|---|---|
| Count | [Series], [Grouped by], Sum, Avg, Min, Max, Unique Devices |
| Average | [Series], [Grouped by], Avg, Unique Devices |
| Rate | [Series], [Grouped by], Avg, Min, Max, Unique Devices |
| Histogram | [Series], [Grouped by], Percentile (user-defined) |
Series and grouped-by columns
-
Series. If a chart includes multiple series, each series appears as a value in the Series column of the table. Each row represents a unique combination of series and any grouped-by values.
-
Grouped-by dimensions. If a series is configured with one or more Grouped-by dimensions, each grouped-by dimension appears as its own column in the table. These columns identify how the row is grouped, and the remaining columns contain aggregated values for that group.
Aggregation windows
Data is aggregated into time windows before table values are calculated. The size of these aggregation windows is determined by the selected time range.
| Selected time range | Aggregation window size |
|---|---|
| Less than 4 hours | 1 minute |
| 4 to 36 hours | 15 minutes |
| More than 36 hours | 2 hours |
How values are calculated
-
Avg. The overall average value calculated across all data points within the selected time range.
-
Min / Max. The lowest and highest values observed in any aggregation window within the selected time range.
-
Sum. The total value across all data points within the selected time range.
-
Unique Devices. The total number of distinct devices that reported data during the selected time range.
-
Percentile. Displays the value for the percentile selected in the table's percentile dropdown. Changing the selected percentile updates the values shown in this column.
Ingestion Cardinality Limits
The cardinality of a metric is the total number of distinct tags found for a metric, over a particular time window. For example, if in a 2 hour window a metric has
data points with tags [('tag1', 'foo1'), ('tag2', 'bar1')], [('tag1', 'foo2'), ('tag2', 'bar2')], and [('tag1', 'foo2'), ('tag2', 'bar3')], it would have a
cardinality of 3.
To avoid mistakes with excessive cardinality that would lead to useless charts (for example if a UUID was used as a group by field), Capture applies cardinality limits in multiple different places:
- Each metric is limited to 500 different group by dimensions on the client during each aggregation interval. The avoids unbounded memory growth on the client.
- Each metric is globally limited to 1000 different group by dimensions per approximately every 30 rolling minutes.
- Each metric is globally limited to 20,000 different total dimensions, including platform, app ID, and app version, per approximately every 30 rolling minutes.
If any of these limits are hit, metrics will begin to be dropped. If metrics are dropped, a toast will be shown in the chart UI as shown below, and example cardinality can be inspected to understand how workflows should be adjusted to lower overall cardinality. Contact support if cardinality limits need to be increased for legitimate purposes.
Query Cardinality Limits
During group by queries, if too much cardinality has been ingested over the query time window such that a useful chart cannot be produced (e.g., there would be tens of thousands of lines), the system may fall back to a non-group by query. If this happens a toast will be displayed as shown below, and example cardinality can be inspected to understand how workflows should be adjusted to lower overall cardinality. Contact support if cardinality limits need to be increased for legitimate purposes.

Create Funnel
Create a funnel by linking a series of matchers steps and attaching a funnel action at the end. This action increments a counter for every log matcher step that precedes it, going back to the root of the workflow. It enables a funnel visualization that segments and compares each of the steps using both raw counts and percentages.
Clicking the pencil icon allows you to edit the title of each step of the visualization to improve clarity.

Create User Journey diagram
To create User Journey diagram you start by identifying the steps that you want to cover in the diagram by defining Generic or Default match conditions that need to occur in the app events or logs that you want to track the journey for. Make sure you connect matches that may repeat multiple times and/or are generic with loops to themselves to represent an action that can happen multiple times, before matching exit scenarios.
For example, the following configuration will create the User Journey that starts with the app launch and the Home screen being presented, capture any screen that will be navigated to before the app is moved to background.
Minimum configuration
A minimum working configuration for a User journey to be captured is:
- Starting condition matcher
- Intermediate step that is repeated multiple times (marked with a Workflow loop) and needs to have an attribute that identifies the screen or action (see below for an example)
- End condition which represents the last step in the User Journey Sankey diagram

When configuring such a User Journey diagram it is necessary to have log events on the device that clearly identify the actions or screens that you're trying to base the diagram on. Generally driving the User Journey Sankey diagrams from events that represent navigation from screen to screen makes most sense. See the Screen Views section for a way to instrument this data.
For the screens in the navigation that are not explicitly matched to, to be correctly labeled, you are required to have the screen name present in a field on the log entry that will match the navigation event, for this to be picked up by bitdrift when building out the Sankey diagram of the User Journey. In the following example, a field with the name parameter would have to be present.

Here's a real world example of a User Journey diagram tracking all of the users between the launch of the application until they force quit.

Workflow Loops
Workflow loops are a powerful feature that allows expressing actions that should be repeatedly executed based on the log data. A terminal match node (e.g. one that does not otherwise link to a subsequent match node) can loop back to a previous match node on the path from the start node.

In the example above, the workflow continues to look for a single low battery event, then proceeds to emit a counter metric every time it sees a memory pressure event.
Workflows with a loop often have branches with no terminal match node, which means they run until the workflow ends by other means, see Workflow Lifecycle.
Workflow Variables
Variables (also referred to as dimensions) are attributes that can be attached to a workflow to enable data segmentation and filtering. They allow users to define which fields they care about analyzing across different workflows. Once selected, these variables are used to power interactive filters in custom dashboards.
Adding Variables to a Workflow
To configure variables:
- Open any workflow in the editor.
- Click on
Add Variablesin the top toolbar (the paper pile icon). -
A popup will appear with:
- A search bar to navigate through valid fields
- A list of known fields based on the current workflow's match conditions and structure.
These may include:
- Default fields such as os, app_version, model, network_type, etc.
- Any common fields that are used in the workflow's match conditions.
-
If the search term doesn't return any known fields, you can still add it as a custom variable. For example, searching for foobar allows you to select it even if no data for that field exists yet.
Once selected, variables are saved as part of the workflow configuration.

Warning
Keep in mind that if you add a variable to an existing workflow, you will not be able to filter any data that was collected before the variable was added.
Using Variables in Exploration Dashboards
When viewing an Exploration (a group of workflows), bitdrift automatically computes the intersection of all variables selected across all workflows within that exploration.
This intersection becomes the list of variables available to use as filters in charts and session lists, enabling users to segment their data based on these attributes.

Tip
Variables make it easy to drill into patterns. For example, if two workflows use http.status_code and app_version as variables, you can filter the entire exploration to only show data for status_code = 500 on app_version = 2.3.1.
Deployment
A workflow must be deployed in order for it to be delivered to all connected mobile clients.
Warning
Only the workflow author can edit, deploy, or stop workflows.
Workflow Expiry (TTL)
Workflows have a default expiration policy (Time To Live) to ensure unused configurations do not remain deployed indefinitely. By default, a workflow expires after 30 days of no usage. Usage is defined as any time a user views data from the workflow, such as rendering a chart in an Exploration Report or on the Workflow page.
Configuration is primarily used to adjust this time period to suit specific needs. You can shorten or lengthen the duration, or explicitly disable the TTL entirely if the workflow must remain permanently active regardless of usage.
Note
Adding an alert to a workflow automatically disables the TTL, so you do not need to worry about expiration for workflows used for alerting.
Aggregated Insights
Insights provides detailed visualizations and breakdowns of what's happening in your mobile fleet. Included as part of every workflow, bitdrift captures detailed metadata about the attributes of the users and their devices. This provides and alternative to manually looking through example sessions to find commonalities and patterns amongst impacted users.

Info
Insights are available for workflows with a Plot Chart and/or a Record Session action at this time. They are also only available if data segmentation is enabled.
Pattern Filters
Pattern filters allow you to filter the data displayed in the insights widgets. Filters can be applied by clicking on the bar of the attribute you want to filter by. This works for both the expanded and collapsed view.
Tip
Only one filter per field is allowed, but you can combine filters across different fields.

Comparing Dimensions
When a workflow has multiple paths leading to a Plot Chart action, insights will allow you to compare the different dimensions. In the pattern filters sidebar, you can select which dimensions you want to compare. Only two dimensions can be compared at a time.

Bar Chart
For bar charts, insights will be grouped so that dimensions can easily be compared.

Time Series
For time series charts, the insights data for each dimension will be displayed in the same chart. You can toggle the visibility of each field value, or can focus on the same field value across different dimensions.

Workflow Debugger
Real-time Workflow Validation
The Workflow Debugger introduces a new way to build, test, and validate workflows directly, eliminating the guesswork traditionally involved in creating match conditions.
Workflows can be highly expressive and powerful, but historically they have also been fragile: a single typo in a regular expression or a mismatched field name could cause a workflow to silently fail to match any logs. With the Workflow Debugger, those frustrations are a thing of the past.
To access the Workflow Debugger, open any workflow and click the Debug icon in the top-right corner.

Key Features
- Direct Device Attachment: Connect a development device instantly using a short code, allowing real-time testing against a real or simulated environment.
- Live Log Streaming: See device logs as they arrive. The same capability provided by
bd tail, now seamlessly integrated into the UI. - Visual Step Execution: Each node in the workflow graph lights up when its match condition is triggered, displaying execution counts in near real-time (<1s latency).
- Resource and Session Insights: Observe device resource utilization and live session replay alongside the workflow's progress.
- Instant Feedback: Instantly verify whether your workflow will correctly match on emitted logs before deployment, reducing iteration time and boosting confidence.
Global Workflow Step Counts
Beyond local debugging, global step counts are now available for all deployed workflows. These counts, powered by lightweight debug telemetry, show how often each workflow step has been matched across your entire fleet.

This visualization makes it easy to identify:
- Steps that frequently match and drive actions
- Steps that never match (potentially due to typos or outdated log structures)
- Bottlenecks or unexpected branches in complex workflows
By combining real-time debugging with global visibility, you can build robust, high-fidelity workflows with ease.
-
The SDK is configured to stream up to 100,000 logs. This limit can be configured on per-workflow 'Record Session' action basis - contact us if you are in interested in modifying it. ↩